




Factory Intelligence in Qatar
Production monitoring software that reads the PLCs on your lines: live machine status, OEE by line and shift, every stop with its reason, and a shift report that's ready before the handover.
Last updated

What is production monitoring software?
Production monitoring software reads machine states and counts straight from the PLCs on a production line and shows, as it happens, whether each machine is running, idle or stopped. It calculates OEE, logs every stop with its reason and builds the shift report, so your losses are measured instead of estimated.
The PLC on each filler, labeller or press already knows whether it is running and how many units it has made and rejected. Production monitoring reads those values onto one timeline for the line, and asks the operator for a reason only when a machine stops. It sits between the spreadsheet and a full MES.
Paper and spreadsheets
Counts and stops written up at the end of the shift. Short stops and slow running never make it onto the sheet.
Full MES
Scheduling, recipes, batch genealogy and more. A long project, and more than many plants need to start.
Production monitoring
Live state, OEE and stop reasons from the PLCs in weeks, with room to grow.
Sound familiar?
What plant and production managers in Qatar tell us before we start.
"We find out the line was down from the shift report the next morning."
By the time the numbers are typed up, the shift that lost the time has gone home, and nobody knows if it was one breakdown or twenty small jams.
"Every shift lead gives the same stop a different name."
Free-text notes can't be added up, so the biggest loss on the line stays hidden behind the loudest one.
"Our machines come from five vendors and twenty years."
Food, packaging and building-materials plants in Mesaieed and the Qatar Free Zones often run a new filler beside an old palletiser, and nobody wants to touch a working PLC program to get the data out.
What it measures on every line.
Every lost minute of planned production time lands in one of these buckets, recorded from the machine.
| Loss | What Quoriam records | Where the data comes from |
|---|---|---|
| Breakdowns and unplanned stops | Each stop with its start, end, machine and reason | PLC run state; reason from the line tablet |
| Changeovers | Last good unit of one SKU to first good unit of the next | PLC SKU tag and counts |
| Minor stops | Stops under two minutes, coded automatically | PLC run state |
| Slow running | Actual rate against the rated speed for the SKU on the line | PLC counters and the rated speed per SKU |
| Starved and blocked | Idle time caused by the machine before or after, and buffer levels | PLC states and buffer sensors |
| Rejects | Rejected units by machine, and by cause where reported | Reject counters and inspection systems |
How OEE is calculated.
Overall equipment effectiveness compares what a line made with what it could have made in its planned time: three ratios multiplied together.
| Factor | Formula | Worked example |
|---|---|---|
| AvailabilityLost to stops and changeovers | Run time ÷ planned production time | 378 ÷ 420 min = 90% |
| PerformanceLost to slow running and minor stops | (Ideal cycle time × total count) ÷ run time | (0.6 s × 34,020) ÷ 378 min = 90% |
| QualityLost to rejects | Good count ÷ total count | 33,340 ÷ 34,020 = 98% |
| OEE | Availability × performance × quality | 0.90 × 0.90 × 0.98 = 79.4% |
Worked example, illustrative numbers only: an 8-hour shift with 60 minutes of breaks gives 420 minutes of planned production time; 42 minutes of stops leave 378 minutes of run time; the ideal cycle time is 0.6 s (100 units a minute); 34,020 units made, 680 rejected. Stop time includes changeovers as well as breakdowns. Definitions: OEE.com, Calculating OEE.
How it works on Quoriam.
Connect
A Quoriam Edge QE35 gateway reads each PLC over OPC UA, read-only, so control logic is never touched. Machines without a PLC get a count sensor.
Map
We map each machine's tags to its state, counts and SKU, and load your shift calendar and rated speeds.
Code
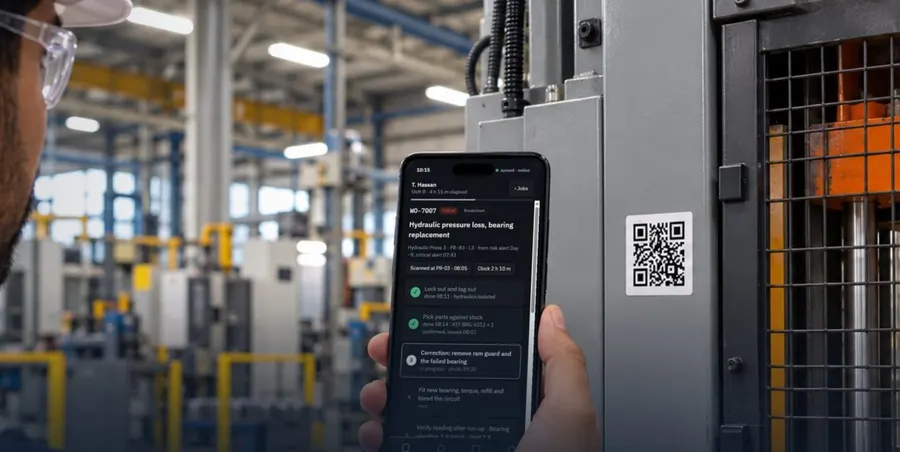
When a machine stops, the operator picks the reason on a line tablet, with a suggestion from the PLC. Short stops are coded automatically.
Improve
OEE, the stop Pareto and the shift report update live. The shift lead is alerted when the constraint machine stops; mechanical faults become work orders.
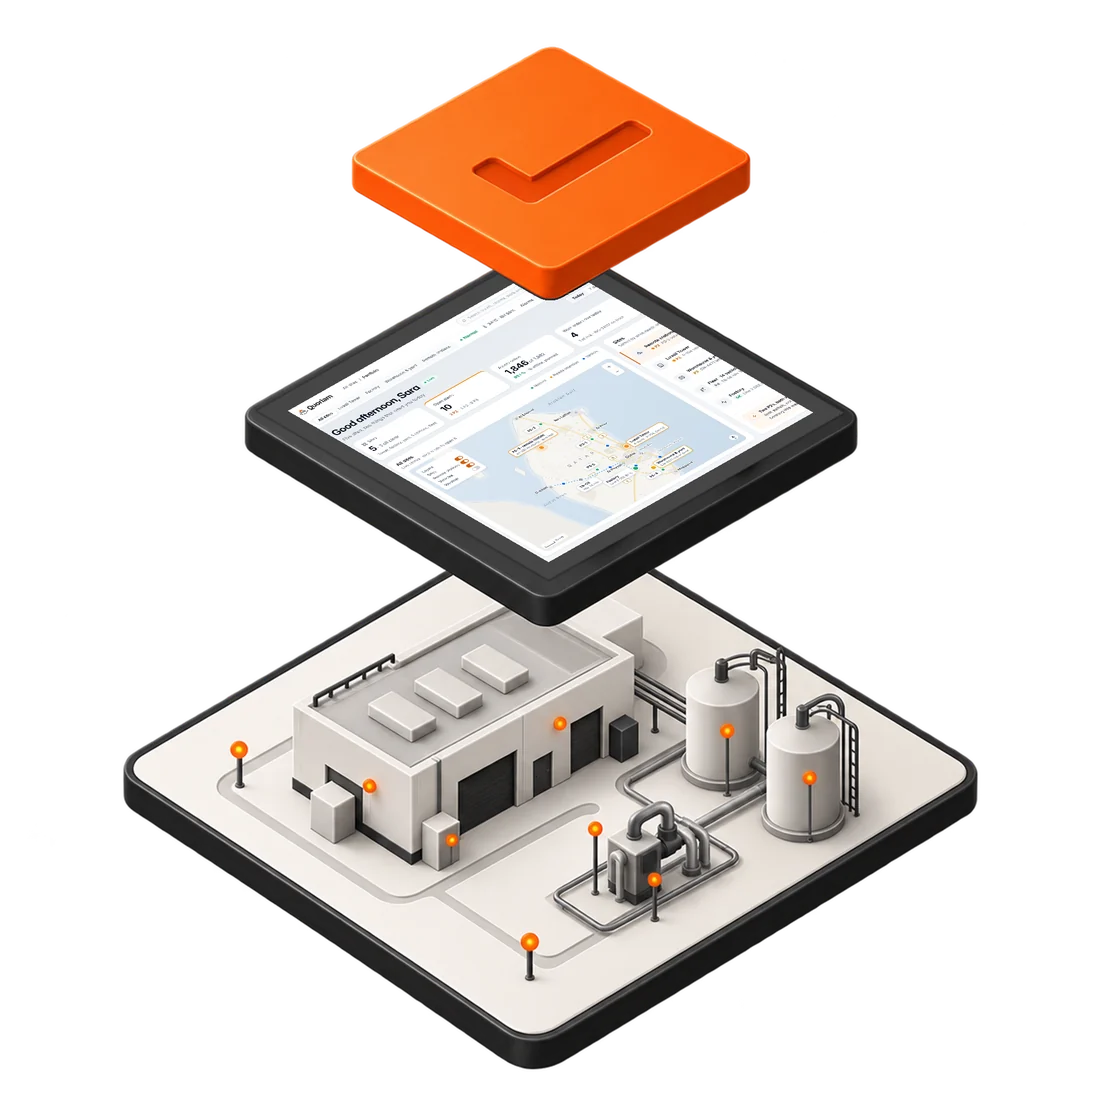
System view
For IT, OT and security reviewers: where the data goes, and how.
- On the lineMachine PLCs, count sensors, energy meters and a tablet at each line
- At the edgeQuoriam Edge QE35 reading PLCs over OPC UA and other industrial protocols, read-only
- NetworkPlant network or cellular, encrypted and kept apart from the control network
- Quoriam platformOn your premises or cloud hosted in Qatar
- Your team and systemsLine boards, shift reports by PDF, alerts to shift leads, work orders to maintenance, data to your ERP
What your team sees.
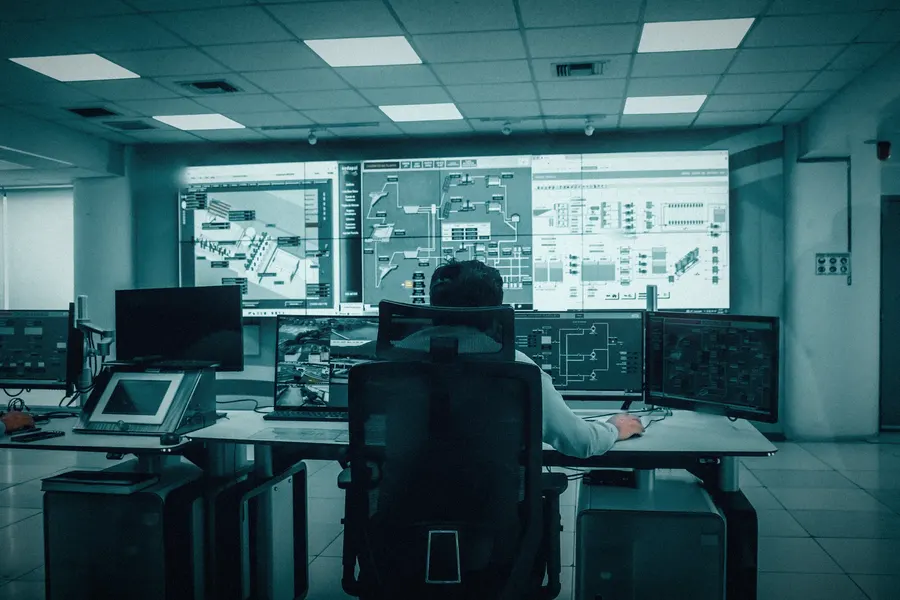
The line as it runs, where the time went, and what to fix first.
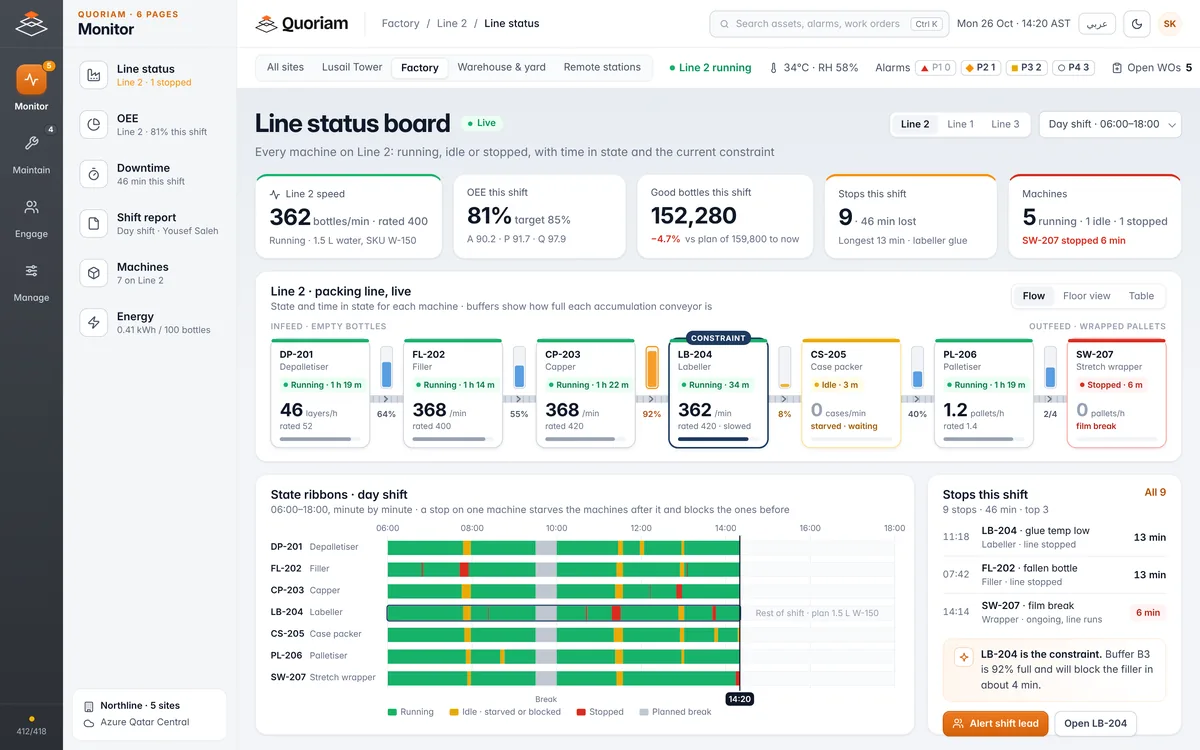
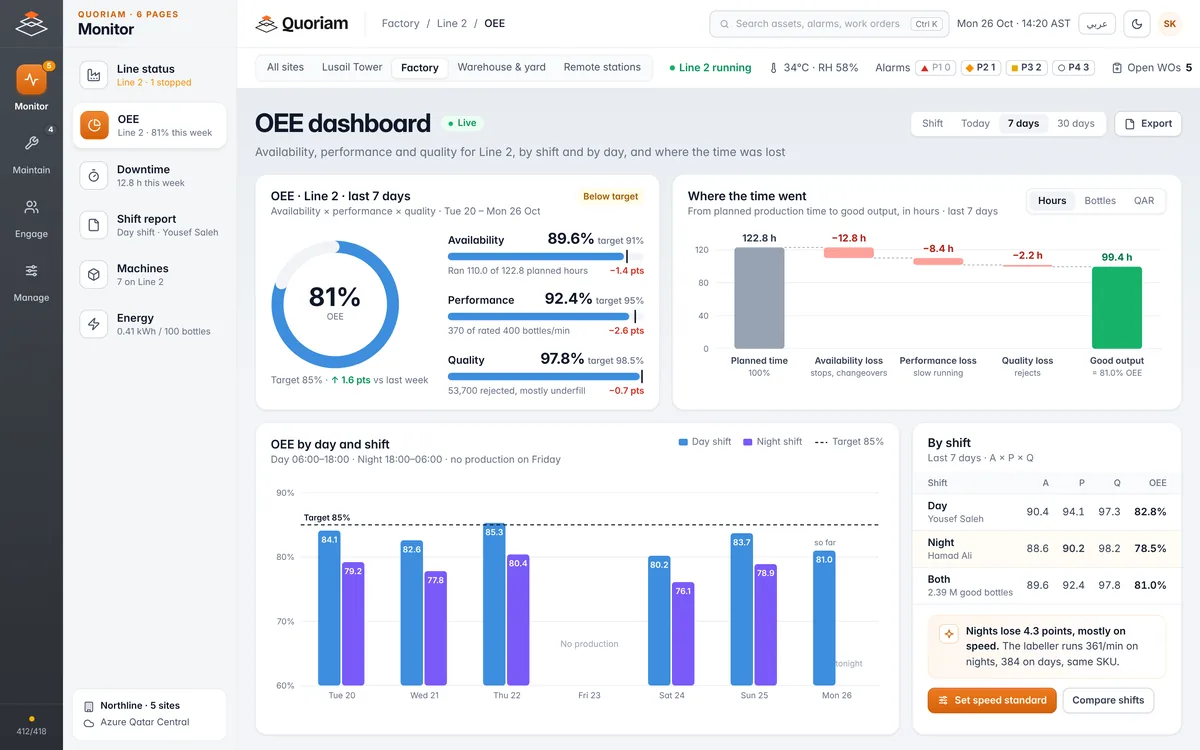
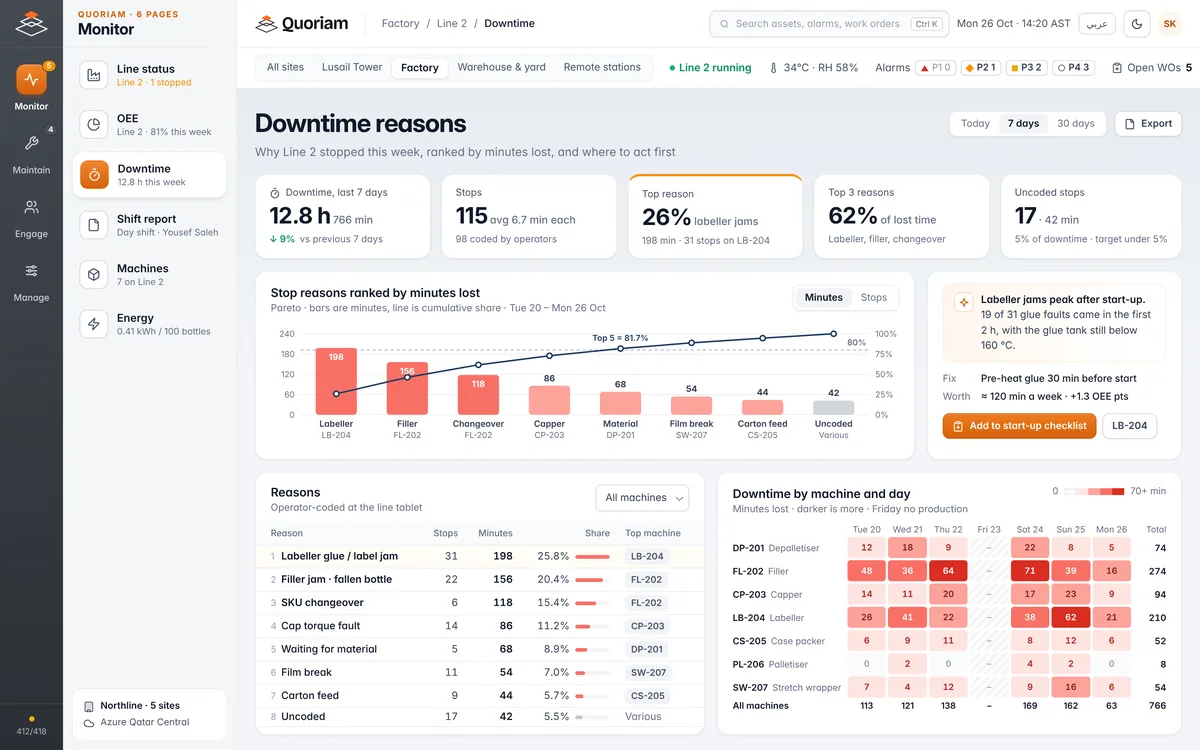
Or just ask.
Quoriam AI answers questions about your lines in plain language and turns the answer into an action.
Factory intelligence use cases.
Start with the line that sets the pace for the plant.
Hardware and integrations.
We read the controllers you already run and add hardware only where a machine has nothing to read.
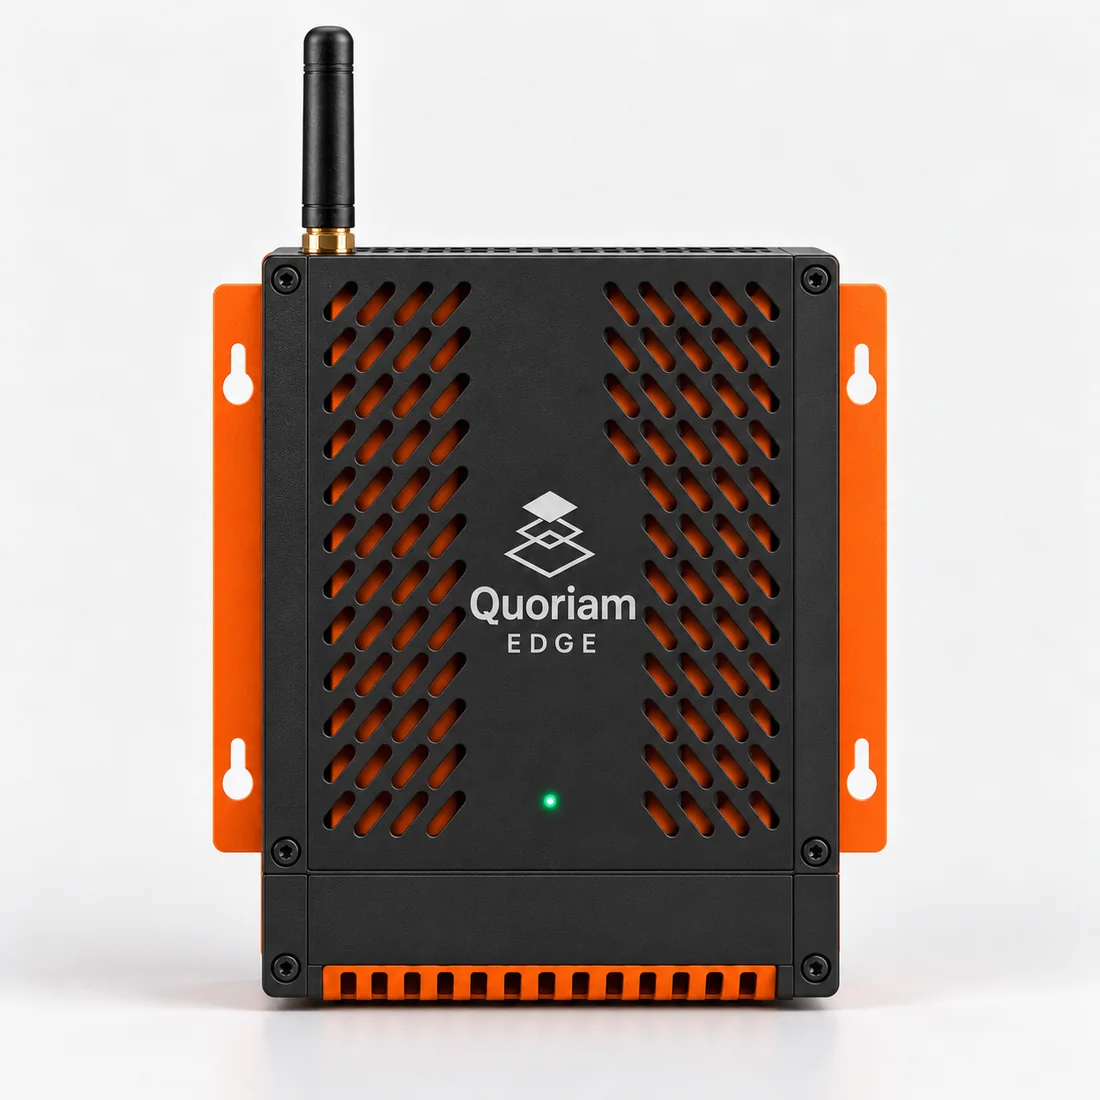
- Edge gatewayQuoriam Edge QE35, reads PLCs on site
- Line tabletsOne per line or station, for stop reasons and handover notes
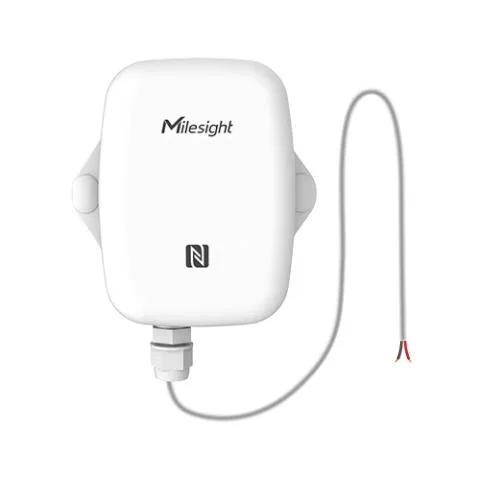
- Count and state sensorsFor machines with no PLC to read
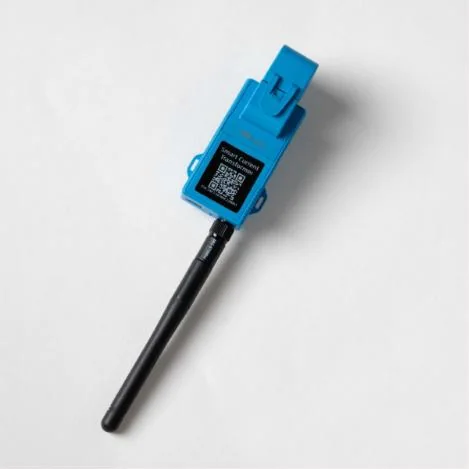
- Energy metersOn line feeders, for energy per unit
- Reads from
- Siemens, Rockwell, Schneider, ABB, Mitsubishi and Omron PLCs over OPC UA, Modbus, Profinet and EtherNet/IP; SCADA over OPC UA
- Sends to
- ERP systems such as SAP, Oracle and Microsoft Dynamics
- Alerts by
- Quoriam app, SMS and email to shift leads and maintenance, with escalation if nobody responds
Hardware agnostic. Makes we fit includeMilesightFootfallCamTeltonikaAdvantechWe can work with any maker and choose the device for each site. The platform reads them all.
Where it's used.
The same platform, set up in each industry's terms.
Questions buyers ask.
Something else? Ask us during the free assessment.
Do you change our PLC programs?
No. The edge gateway reads values the PLC already holds over a read-only connection. Control logic stays exactly as your automation team left it.
Which PLCs and machines can you read?
Siemens, Rockwell, Schneider, ABB, Mitsubishi and Omron controllers, among others, over OPC UA, Modbus, Profinet or EtherNet/IP. Older PLCs without an OPC UA server are read through the gateway's protocol drivers.
How many machines do we need to connect?
Start with one line, connecting each machine whose stops matter. One edge gateway usually serves a line or a hall. The free assessment counts it for your plant.
What does it cost?
It depends on how many lines and machines you connect and how they connect. The free three-week assessment ends with a scope and a fixed price for your plant.
How do operators record downtime reasons?
On a tablet at the line, which suggests the likely reason from the PLC, so a stop is coded in a couple of taps. Uncoded stops show on the report so they can be chased.
Is this an MES?
It covers the monitoring part of an MES: machine state, OEE, downtime and shift reports. Scheduling or batch records can follow on the same data.
What OEE should we aim for?
Start from your own baseline. A month of accurate stop data tells you more than any benchmark, and the target follows from the losses you can remove. We set targets per line with you during the pilot.
Can it work alongside predictive maintenance?
Yes. With predictive maintenance on the same platform, the motors and gearboxes behind the longest stops are watched too.
Add next on the same platform.
Every solution plugs into the one you start with. One login, one set of alarms.
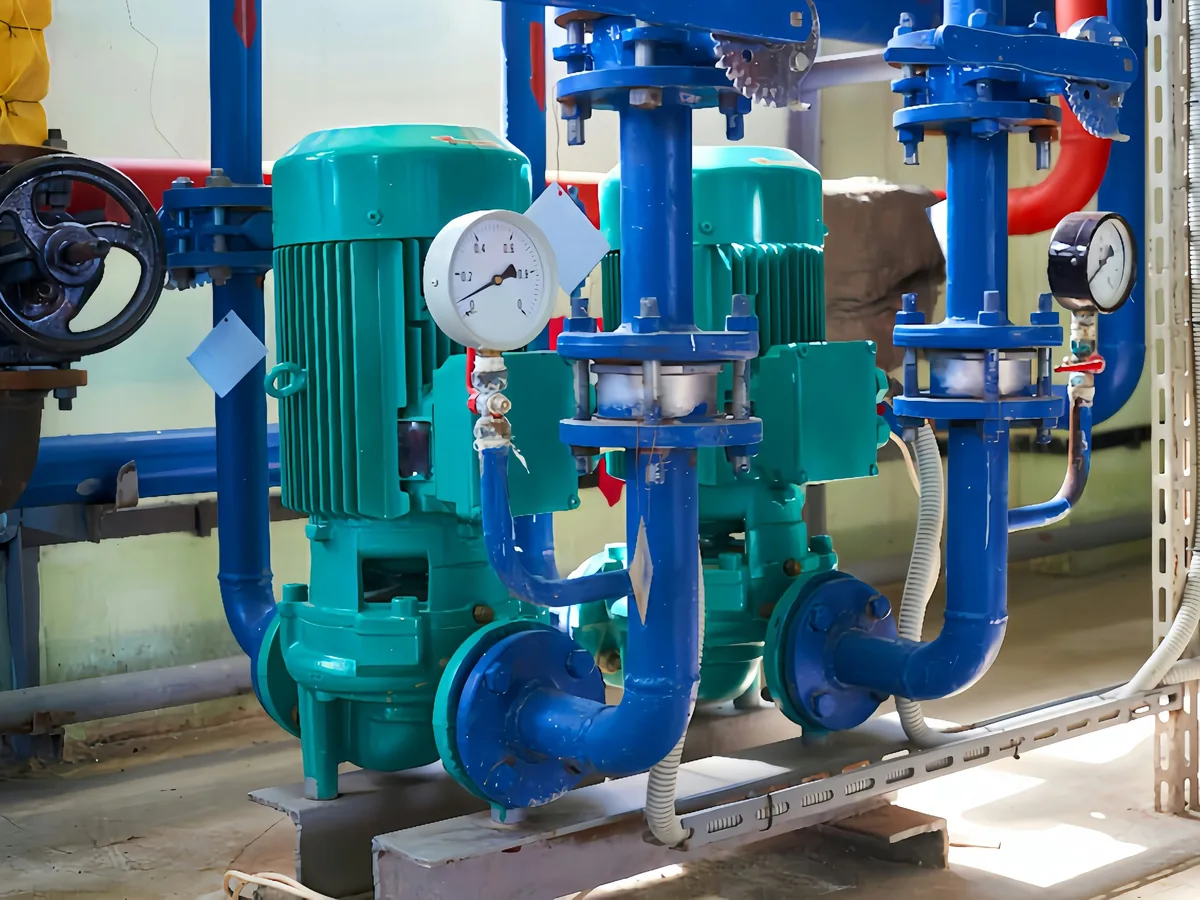 P-104 Vibration 7.1 mm/s
Predictive maintenance
Catch bearing wear, overheating and imbalance weeks before a pump, motor or chiller fails.
 BTU-17 +22% on last month
Smart metering and sub-metering
Meter electricity, water and chilled water by tenant or line, and settle every bill on evidence.
 CN-4471 Left zone B at 14:02
Asset tracking and geofencing
Know where equipment, tools and containers are, and get an alert the moment one leaves its zone.
Start with a pilot.
Prove it on one line before you connect the whole plant.
- One line and its machines chosen with your team in the assessment
- Edge gateway and line tablet supplied, fitted and commissioned by our engineers
- How long it runs is agreed with you, typically around eight weeks
- The results to look for are agreed at the start and reviewed with you at the end
See where your line loses its time.
A free three-week assessment. We review your lines, their PLCs and today's reports, then show you which losses to measure first.
We take on two assessments a month.Quoriam is designed to pay back within six months. How we calculate payback