




- Home
- Solutions
- Factory intelligence
- Downtime tracking
Machine Downtime Tracking in Qatar
Every stop on your line captured from the PLC with its start, end and machine, a reason picked on a tablet at the line, and a ranked list of the losses worth fixing first.
Last updated
What is machine downtime tracking?
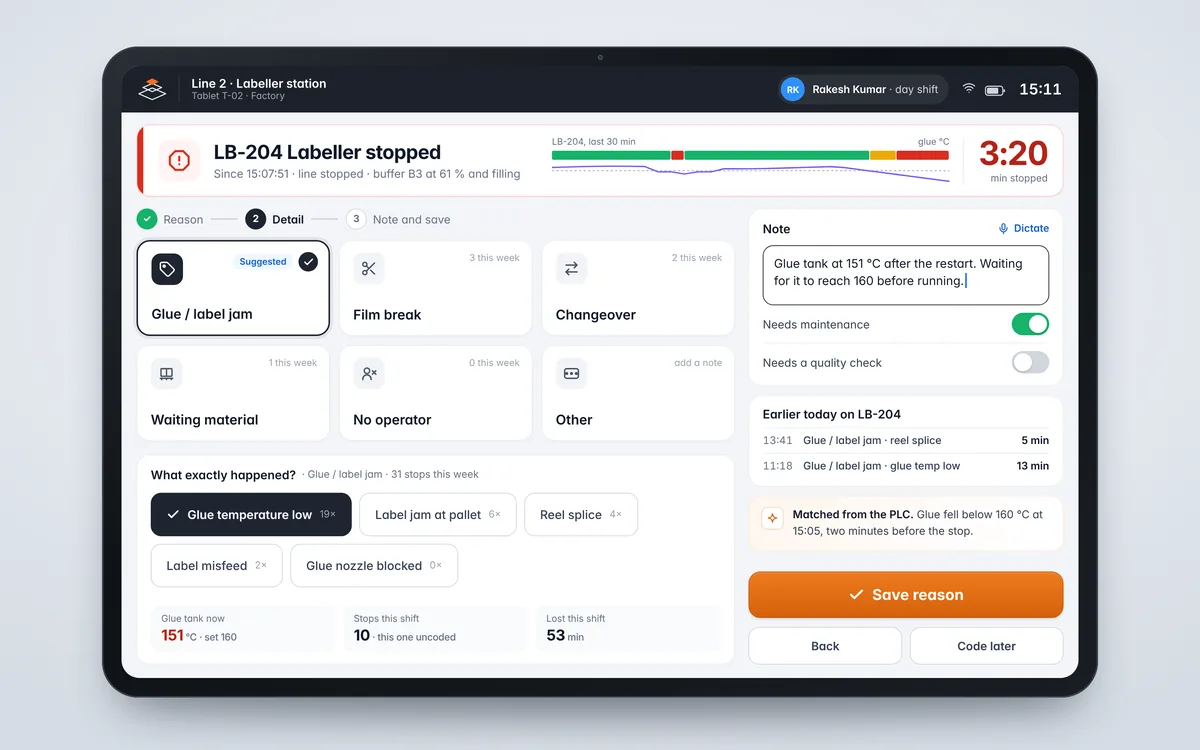
Machine downtime tracking records every time a machine stops, for how long and why. The stop and its duration come straight from the PLC; the operator adds the reason on a tablet at the line. Ranked by minutes lost, the reasons show which few problems cause most of the downtime, so fixes go where they pay back.
A paper log records the stops someone remembered. The PLC records all of them, to the second. Downtime tracking joins the two: the machine supplies when and how long, the operator supplies why, and a fixed reason list keeps every shift using the same words. It is the availability side of OEE monitoring, with the cause attached.
Paper downtime log
Long stops written up at the end of the shift, in each lead's own words. Short stops vanish.
PLC alarm history
Every fault raised, with no sign of which ones stopped the line.
Downtime tracking
Every stop timed by the PLC, coded by the operator, ranked by minutes lost.
Planned or unplanned, every stop has a place.
Arguments about downtime start with what counts. We set these rules up with you, following the common OEE definitions.
| Time | Examples | How it counts |
|---|---|---|
| Not planned to runExcluded | Breaks, no orders, plant shutdown | Taken out of planned production time; no reason needed |
| Planned stopsAvailability loss | Changeovers, planned cleaning and adjustments | Counted as stop time and coded, so you can shorten them |
| Unplanned stopsAvailability loss | Breakdowns, jams, waiting for material or an operator | Counted as stop time and coded at the tablet |
| Minor stopsPerformance loss | Stops of a minute or two that clear without maintenance | Coded automatically below the threshold you set |
Sources: OEE.com, Calculating OEE counts all time the process was meant to run and didn't as stop time, both unplanned stops such as breakdowns and planned stops such as changeovers, and excludes breaks from planned production time. Minor stops: OEE.com, the six big losses.
A reason list that people actually use.
The list decides whether the Pareto means anything.
| Rule | Why it matters | On Quoriam |
|---|---|---|
| Keep it short | Up to about 25 reasons, the smallest set that leads to action | A few reasons per machine on the tablet, with detail under each |
| One meaning per reason | Two operators should never pick different reasons for the same stop | Agreed per machine with your shift leads at setup |
| Detail at the constraint | The pace-setting machine needs detailed reasons; others can start with one | Constraint marked on the line board |
| Watch the leftovers | If 'other' reaches the top ten, it hides a real reason | Uncoded and other shown in the Pareto, against a target |
Reason list guidance: Vorne, Optimizing downtime reasons.
How it works.
Detect
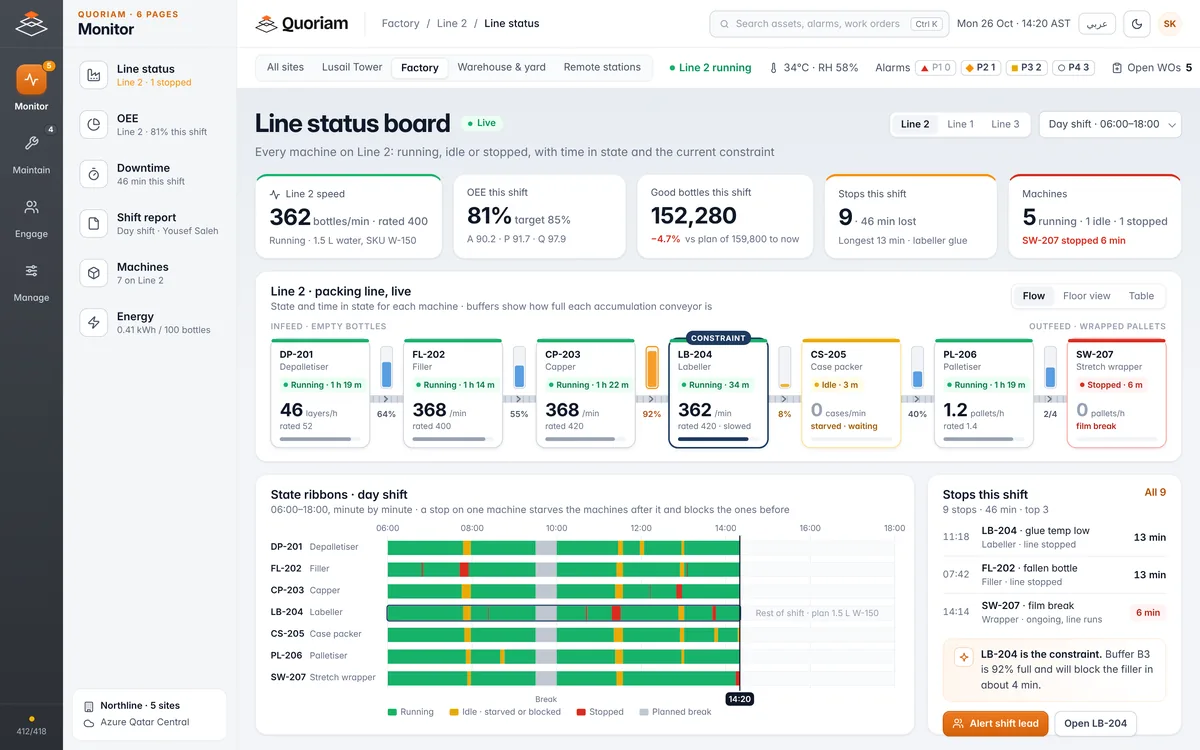
The edge gateway reads each machine's run state from its PLC, read-only. The clock starts the moment the state changes.
Code
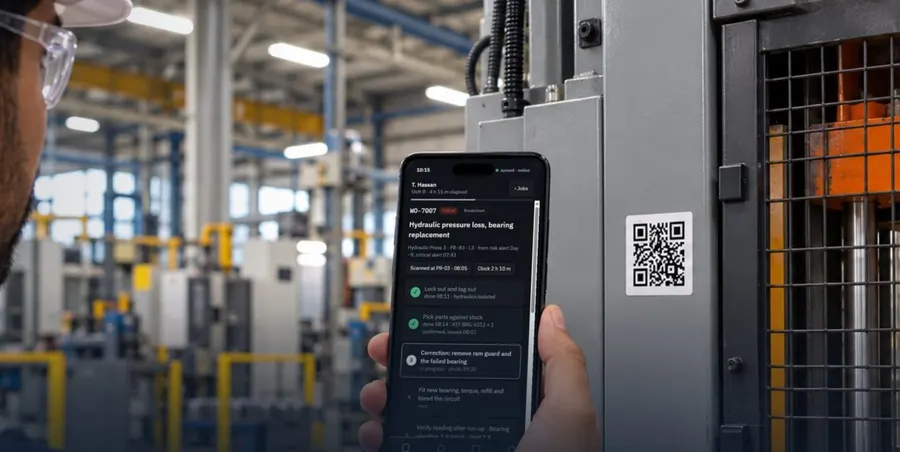
The tablet shows the stopped machine and a reason matched from PLC signals, such as a low glue temperature. The operator confirms it, adds detail or a note, or codes it later.
Escalate
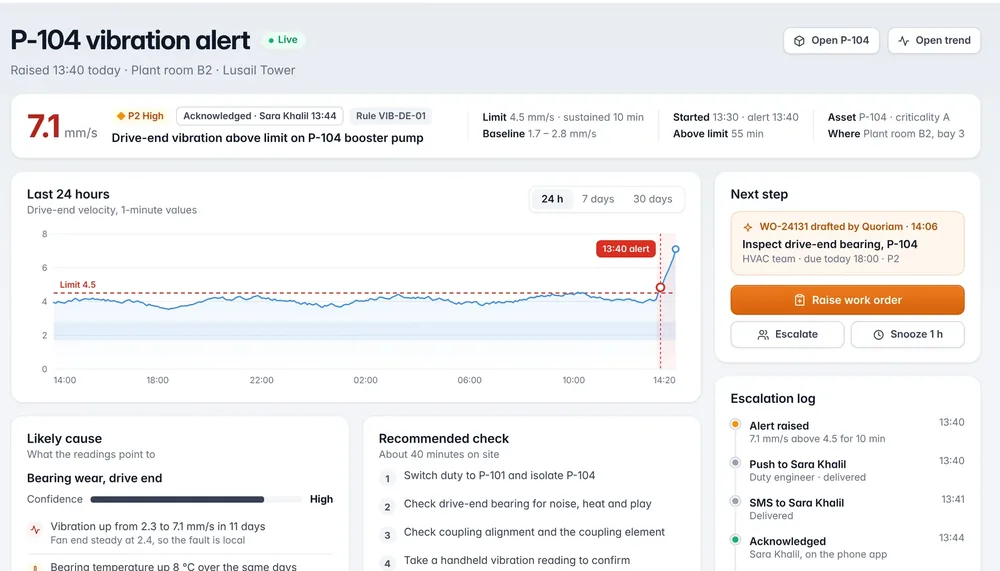
Long stops on the constraint alert the shift lead. A stop flagged for maintenance can raise a work order with the note attached.
Rank
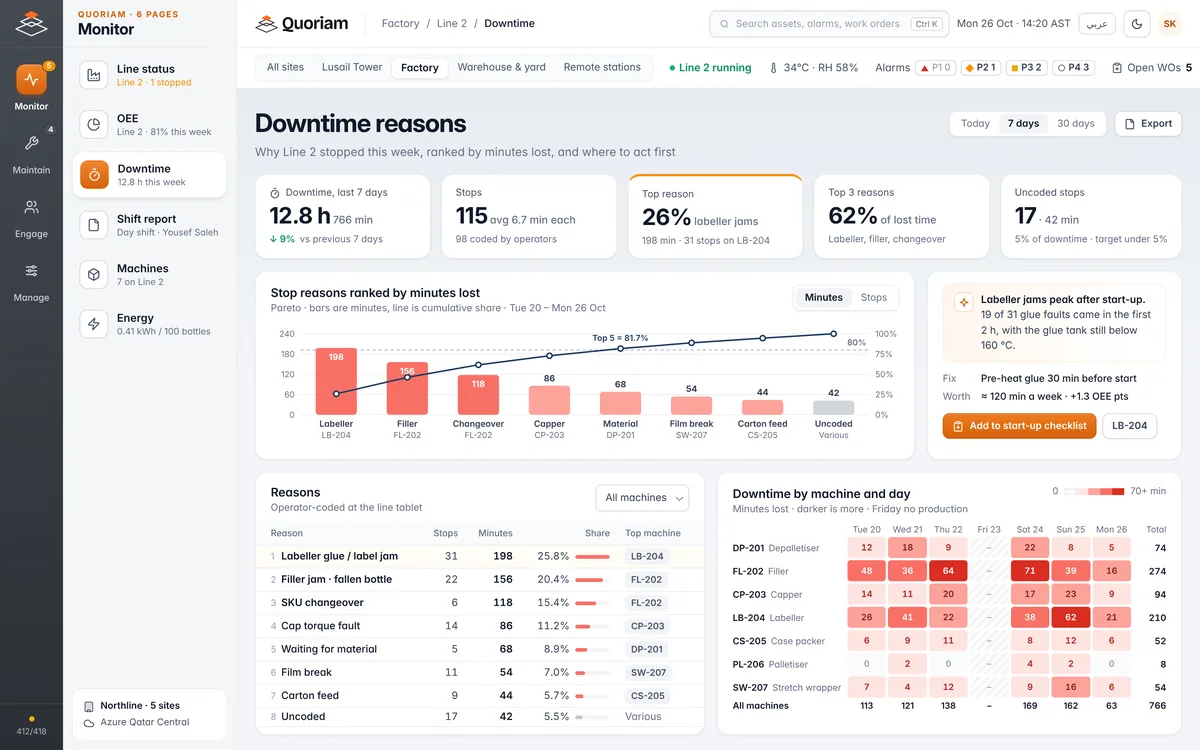
The Pareto ranks reasons by minutes lost, by machine and shift, with uncoded stops kept in view.
System view
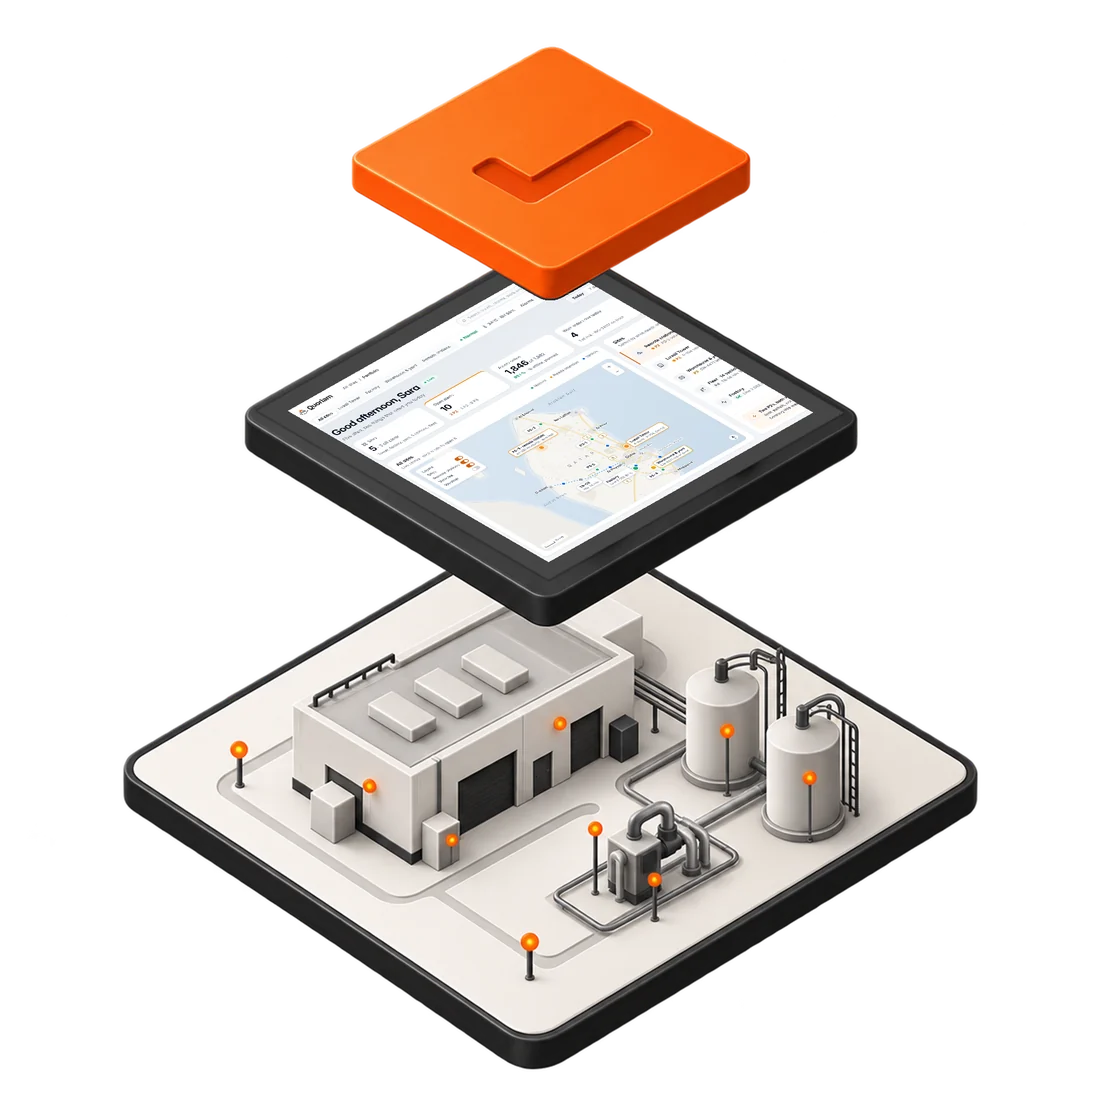
For IT, OT and security reviewers: where the data goes, and how.
- On the lineMachine PLCs, a tablet at each line, state sensors where there is no PLC
- At the edgeQuoriam Edge QE35 reading PLCs, read-only
- NetworkPlant network or cellular, encrypted and kept apart from the control network
- Quoriam platformOn your premises or cloud hosted in Qatar
- Your team and systemsAlerts to shift leads, shift reports, work orders to Quoriam or your CMMS
What your team sees.
Where the time went, and what the operator saw.
Or just ask.
Quoriam AI answers in plain language and turns the answer into an action.
Where it's used in Qatar.
Wherever stops are argued about instead of measured.
Food and beverage
Bottling and packing lines where fillers, labellers and wrappers stop the whole line.
ManufacturingBuilding materials
Block, pipe and precast plants in Mesaieed, where one press or kiln holds up the yard.
Packaging and plastics
Moulding and converting lines with frequent jams and changes.
Mixed-vendor plants
Old and new machines side by side, read in their own protocols onto one timeline.
Questions buyers ask.
Something else? Ask us during the free assessment.
How do you track machine downtime automatically?
The edge gateway reads each machine's run state from its PLC. When it changes to stopped, Quoriam opens a stop with its start time and machine, and closes it when the machine runs again. Nobody types in a duration. The operator only adds the reason.
What downtime reason codes should we use?
Start with the stops your shift leads already argue about, grouped by the part of the machine that failed: glue, labels, film, changeover, material, operator. Keep each machine to a short list, give every reason one meaning, and add detail at the constraint.
Do operators have to code every stop?
Only stops above the minor-stop threshold, usually two minutes; shorter ones are coded automatically. The tablet suggests the likely reason, so most stops take a couple of taps, and an operator clearing a jam can code it later. Uncoded stops stay visible in the Pareto.
Should changeovers count as downtime?
Yes. A changeover is a planned stop: time the line was meant to produce and didn't. OEE.com counts planned stops in stop time, and Quoriam codes them separately, so changeover minutes can be tracked and shortened without hiding them inside the breakdown figures.
What hardware do we need on the line?
An edge gateway to read the PLCs, a tablet at each line or station for reasons and handover notes, and a state sensor on any machine with no PLC to read. One gateway usually serves a line or a hall. The free assessment lists it for your plant.
Can a stop raise a work order in our CMMS?
Yes. A stop flagged for maintenance can raise a work order in Quoriam or in your existing CMMS, such as SAP PM or IBM Maximo, with the machine, the reason and the operator's note attached, so the technician starts with the facts.
What does downtime tracking cost?
It depends on how many machines you connect and how each one connects. Most plants start with one line as a pilot, then add lines once the stop data is trusted. The free three-week assessment ends with a scope and a fixed price.
Related.
Downtime tracking is part of factory intelligence on the Quoriam platform.
- Factory intelligence
Live line status, OEE and downtime reasons from the PLCs you already run.
- OEE monitoring
Availability, performance and quality per line and shift, from the PLC.
- PLC data connectivity
Read Siemens, Rockwell and other PLCs over OPC UA, without touching the control logic.
- Predictive maintenance
Catch bearing wear, overheating and imbalance weeks before a pump, motor or chiller fails.
Find the stops that cost you most.
A free three-week assessment. We review your lines, their PLCs and today's downtime records, then show you which stops to measure first.
We take on two assessments a month.Quoriam is designed to pay back within six months. How we calculate payback