





Business Intelligence in Qatar
One executive dashboard for your portfolio, built from your ERP, CAFM, meters and sensors. Every KPI has one definition and an owner, and every figure opens to the records behind it.
Last updated
What is business intelligence?
Business intelligence turns the records your organisation already keeps into a small set of trusted KPIs and the decisions they call for. Quoriam computes each KPI from your ERP, CAFM, meters and sensors and links every figure to its records. As a Power BI alternative in Qatar it goes further, with live monitoring, alerts, work orders and an owner for every decision.
Most property and facilities groups in Qatar already hold the data, spread across the ERP, the CAFM, meter head-ends and the contact centre. The monthly pack is built by hand, and two departments can report the same KPI with different numbers.
Quoriam business intelligence runs on the Quoriam platform, which already reads your meters and sensors. Each KPI is defined once, then shown to every role that needs it, from the chief executive and CFO to facilities, commercial, procurement, HR, community and project teams, in Arabic or English.
Spreadsheet packs
Rebuilt from exports every month. By the time a number reaches the board, nobody can say which records it came from.
A generic BI tool
Power BI or Tableau draw good charts from data that is already clean and in one place. Getting meter and work order data there, and following up on a chart, stays with your team.
Quoriam business intelligence
Field data and business systems in one KPI catalogue, each figure traced to its records and each decision to an owner. Power BI can pull the certified KPIs and their data through the Quoriam API into existing reports; we set this up on request.
A Power BI alternative that goes well beyond reporting.
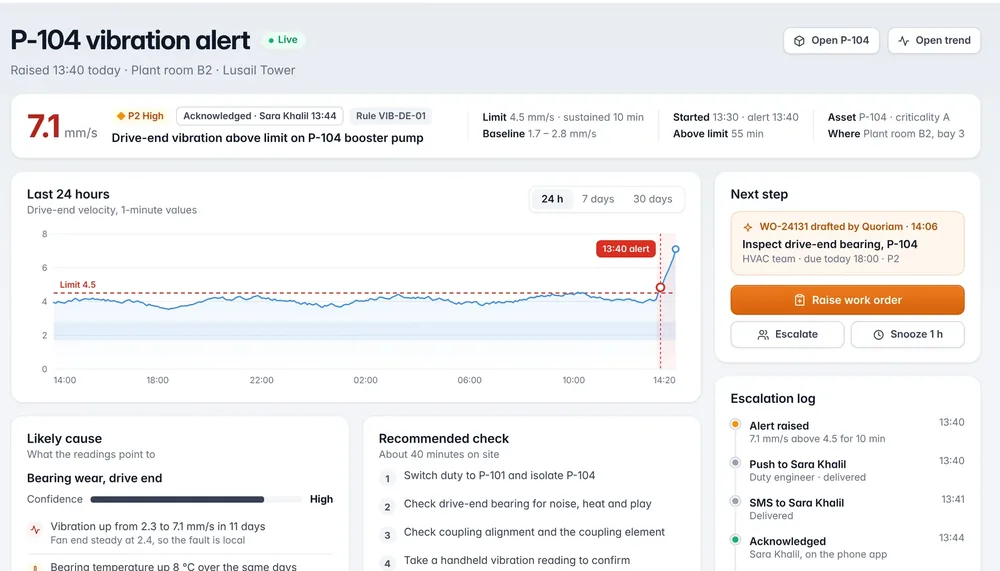
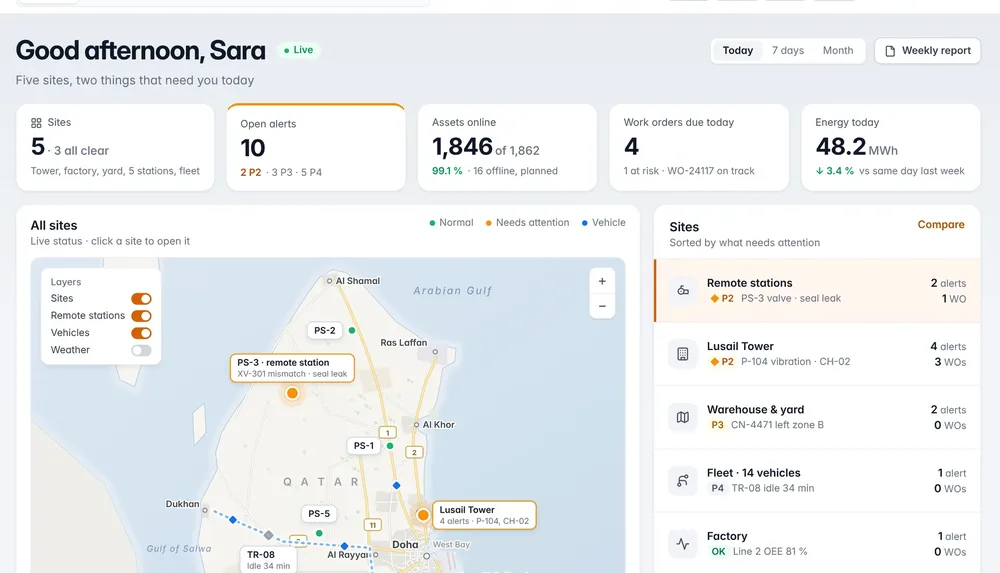
Power BI reports on data that somebody has already collected and prepared. Quoriam does the work before the report and after it. It collects the data from your systems, meters and sensors, watches it around the clock, explains what is changing, raises the work and follows each decision through to an owner.
| Microsoft Power BI | Quoriam | |
|---|---|---|
| Dashboards and reports | Its core strength, across any data your team has prepared | KPI scorecards, a view for each role and a board pack, with every figure traced to its records |
| Collecting the data | Works on sources that your team connects, cleans and models | Connects your ERP and CAFM, reads your PLCs and meters, and installs the sensors that are missing |
| Watching it around the clock | Refreshes reports on a schedule and sends data alerts | Monitors every reading continuously and ranks what needs attention |
| Explaining what changed | Charts and summaries of the report's data, for an analyst to interpret | Quoriam AI explains the likely cause, with the readings and records behind it |
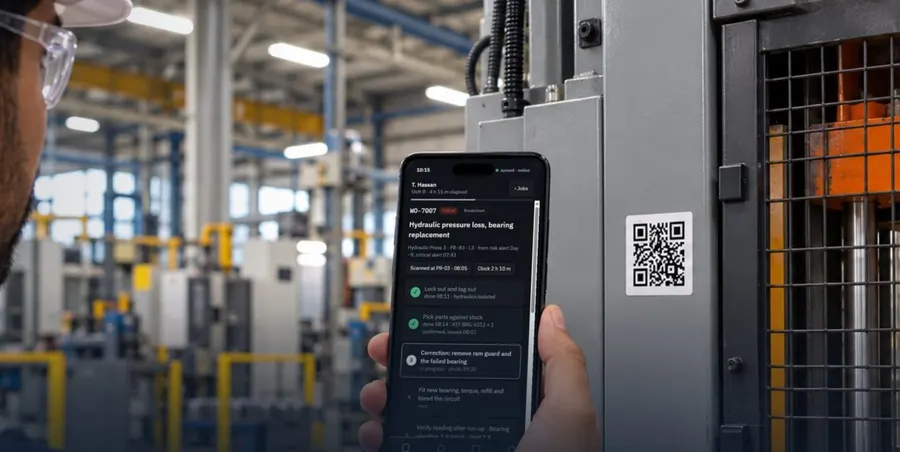
| Acting on it | The follow-up happens in other tools | Drafts the work order or decision for a named person to approve, then tracks it to completion |
| Keeping the knowledge | Holds the reports and their data models | Holds the history of every asset, fault, fix and decision |
| Running on your own servers | Through Power BI Report Server, which is licensed with Fabric F64 or larger reserved capacity, eligible SQL Server core licences (version and Software Assurance conditions apply) or Premium P capacity | The whole platform installed on your own servers |
| Hosting in Qatar | The Power BI service is available in the Qatar Central region; the other Fabric workloads are not offered there | On your own servers or on cloud hosted in Qatar, chosen with your IT team |
| How it is priced | US list prices per user each month: USD 14 for Pro and USD 24 for Premium Per User, paid yearly, or by Fabric capacity | Per deployment, scoped in a free three-week assessment |
| Using both | Stays your reporting tool where teams already work in it | Power BI pulls certified KPIs and their data through the Quoriam API into existing reports; Quoriam sets this up on request |
Where Quoriam goes beyond Power BI.
- It collects the data itselfSensors, meters, PLCs, ERP and CAFM are connected and kept healthy by Quoriam, so the figures do not wait for a data project.
- It watches and explainsReadings are monitored around the clock, and Quoriam AI says what changed, why, and what the evidence is.
- It carries the decision throughEach alert and recommendation ends in a work order or an action with an owner, a due date and a monthly review.
Power BI pricing, Report Server licensing and region availability are from Microsoft's own pages, checked on 18 November 2026: Power BI pricing, Power BI Report Server and Fabric region availability. Power BI and Microsoft Fabric are trademarks of the Microsoft group of companies.
From source record to decision, in four steps.
Any figure on the executive view can be followed back down this path.
- ConnectERP, CAFM or CMMS, sales and leasing, meter head-ends and Quoriam sensors, plus controlled Excel templates for manual figures.
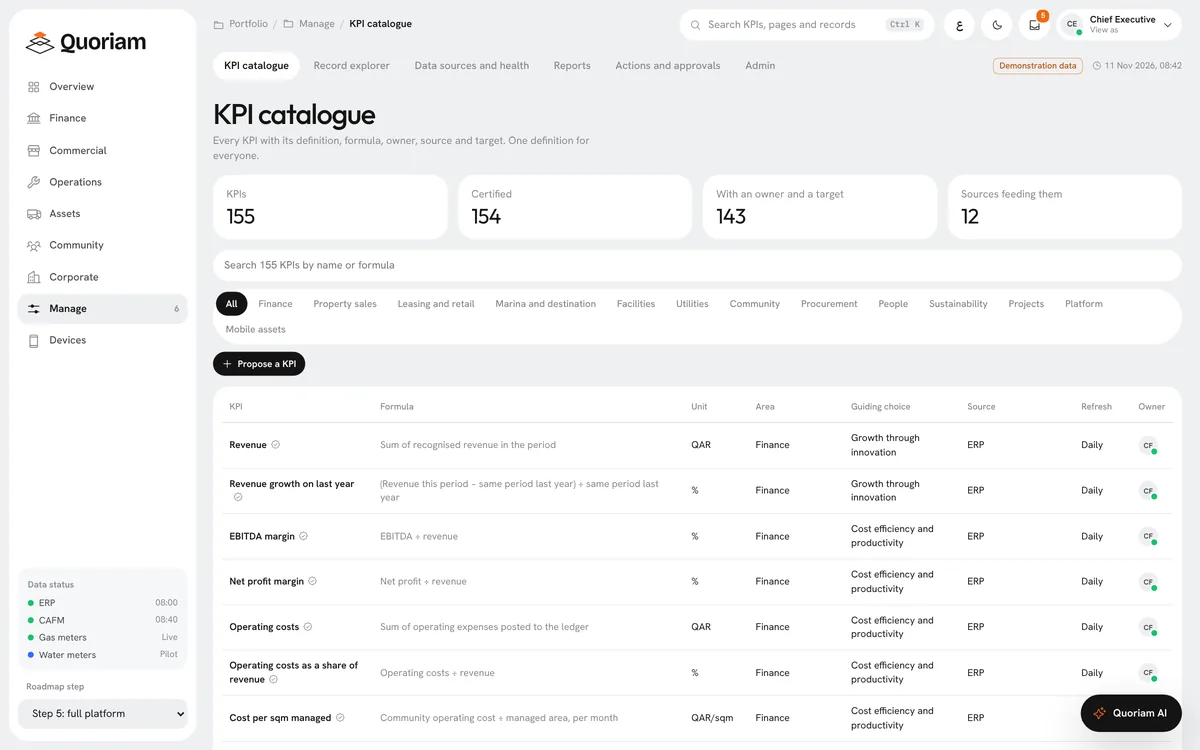
- DefineEach KPI enters the catalogue once, with its formula, owner, source, refresh rate and target, and is certified before use.
- ScoreEvery KPI is marked on track, watch or off track against its target, grouped under the guiding choices in your strategy.
- DecideItems that need a decision are ranked by impact, with the evidence. Approved actions get an owner and a due date, and return at the monthly review.
One set of KPIs, a view for each role.
Each director starts on their own page, with the same numbers the chief executive sees.
| Role | What they see first | Built from |
|---|---|---|
| Chief executive | Scorecard by guiding choice, decisions ranked by impact, the monthly brief | Every area below |
| Finance | Revenue, EBITDA margin, operating costs, service-charge recovery, receivables over 90 days | ERP |
| Facilities | Work order backlog, jobs past SLA, planned maintenance on time, contractor scorecards | CAFM |
| Utilities | Gas billed and recovered, water lost to leaks, leak response time, meter and gateway health | Meter head-ends and Quoriam sensors |
| Procurement | Spend under contract, off-contract spend, invoices without a purchase order | ERP |
| HR | Headcount, attrition, Qatarisation and overtime, as counts and rates only | ERP (HR) |
| Community | Resident satisfaction, requests resolved within SLA, repeat complaints | Surveys and existing apps |
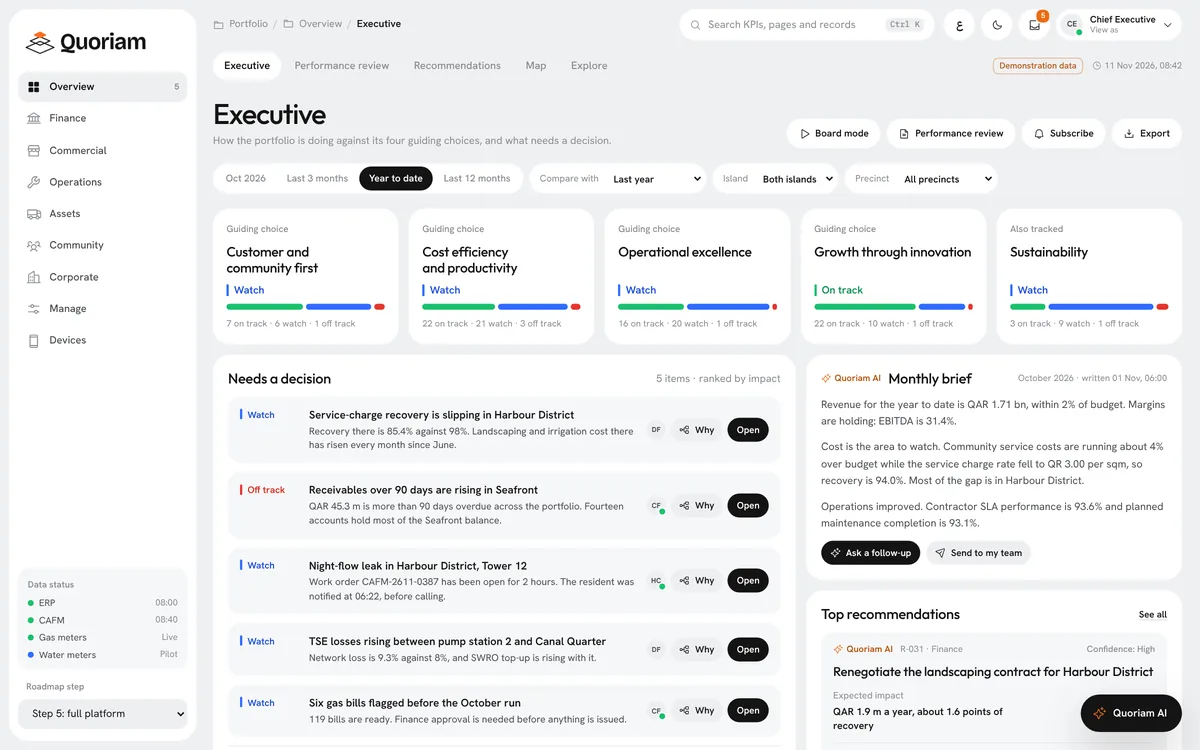
From the scorecard to an owned action.
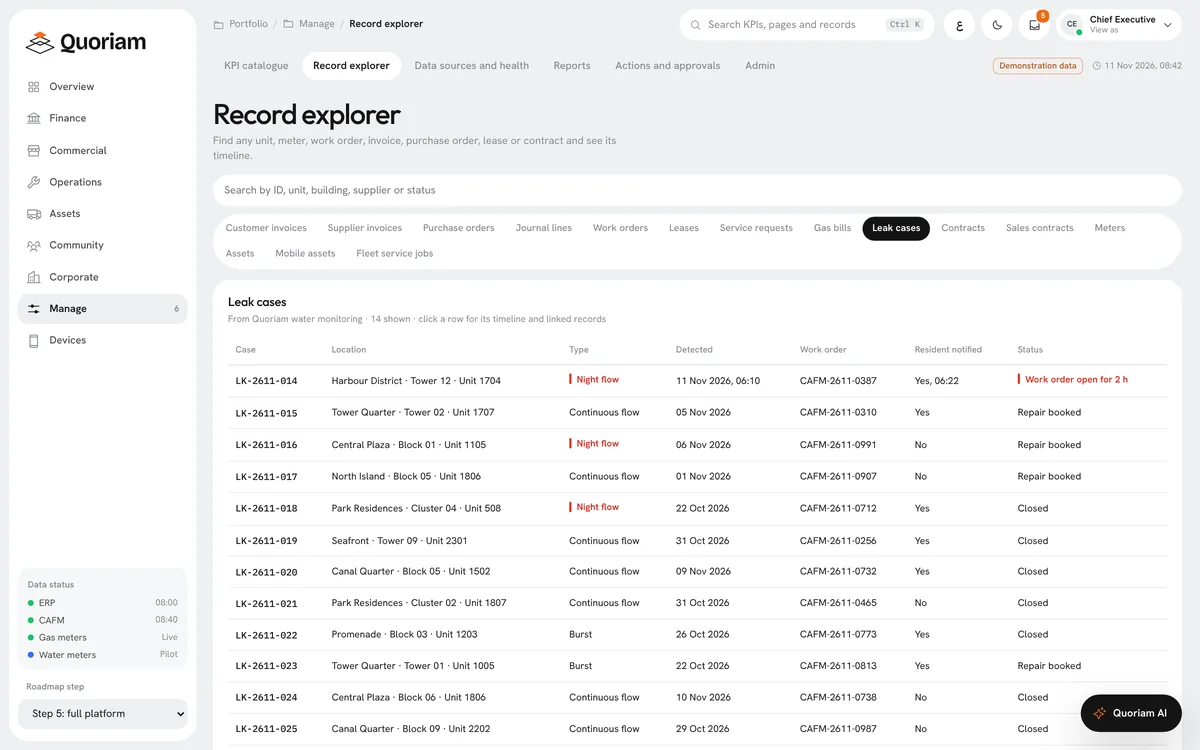
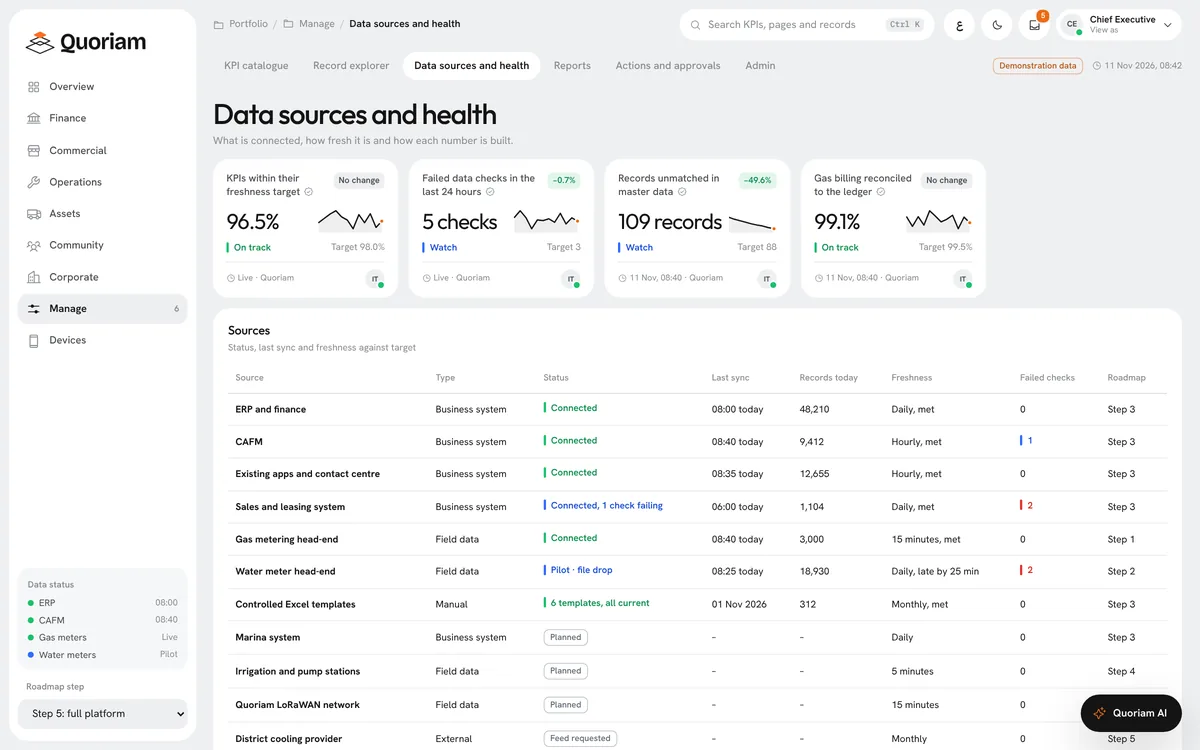
Real Quoriam screens, with example data for a fictional waterfront portfolio.
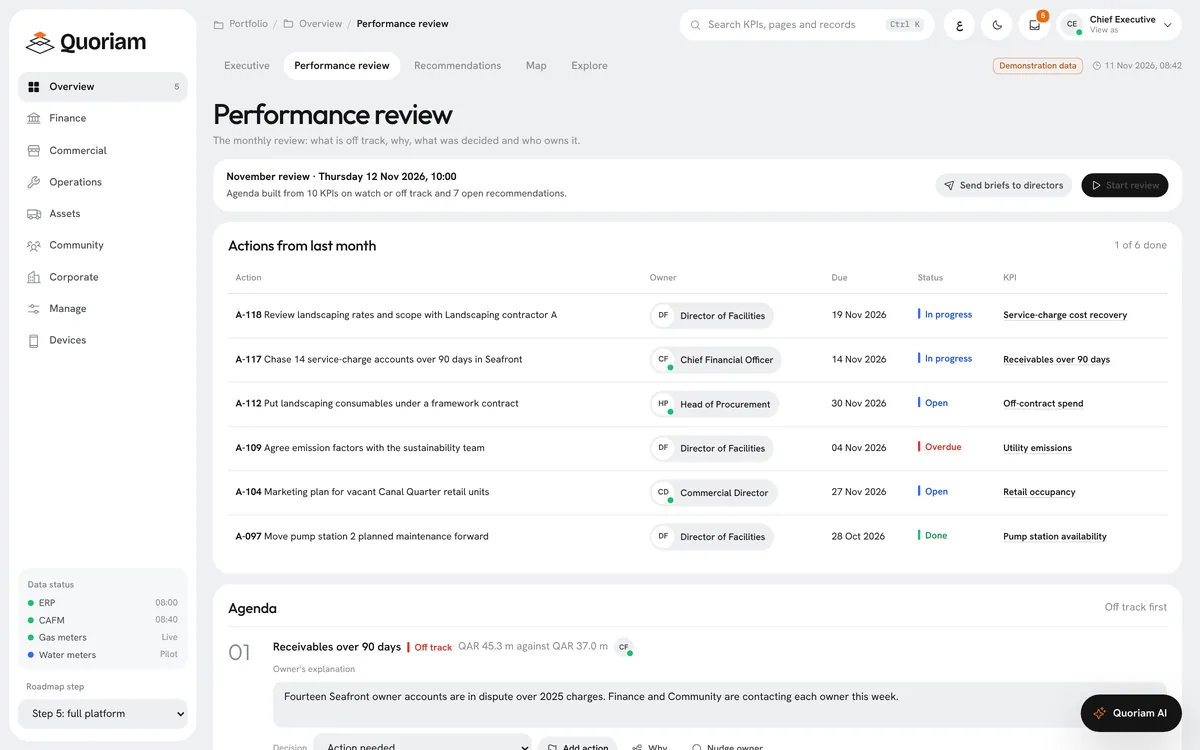
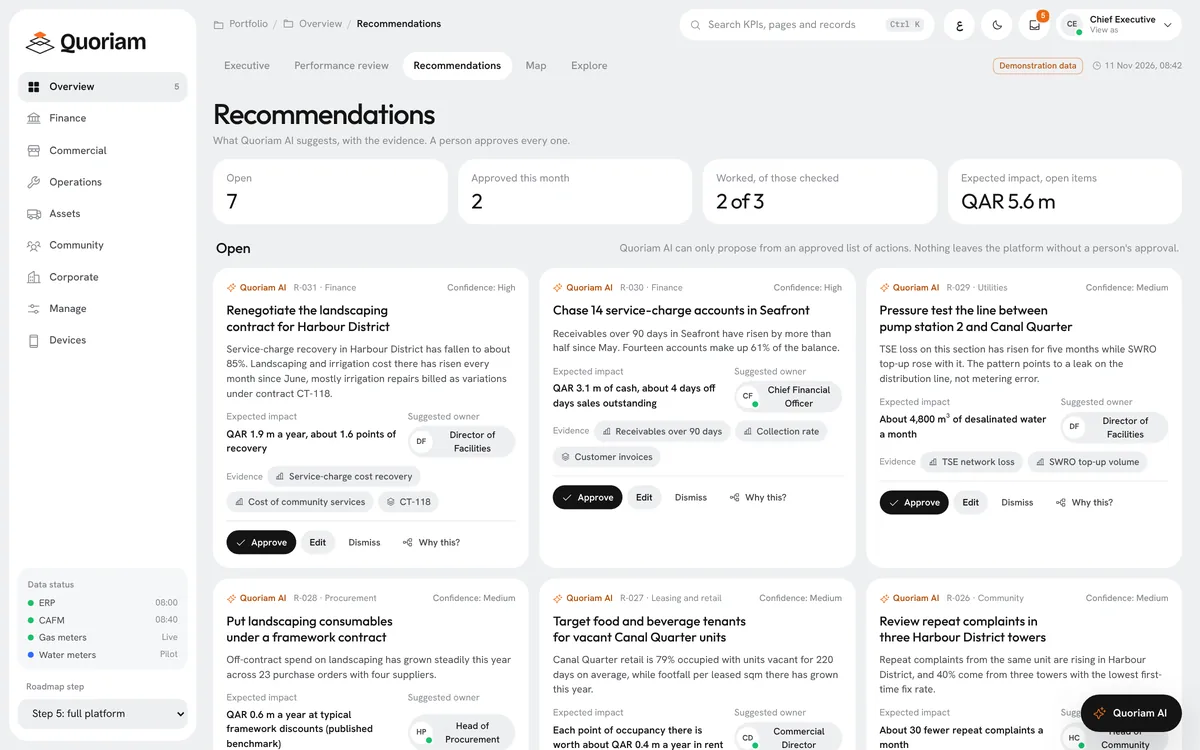
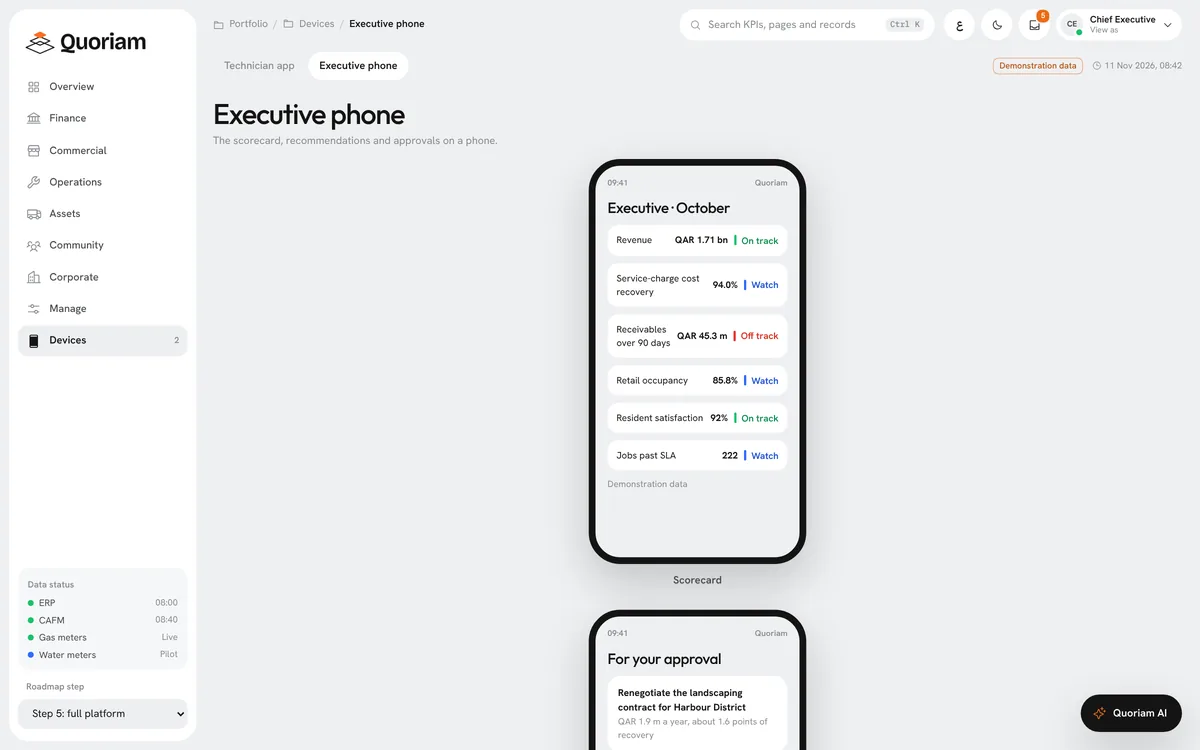
Decisions the KPIs raise.
From the example portfolio on the screens. Illustrative only; these are not client results.
| What the KPIs show | The decision | Who owns it |
|---|---|---|
| Service-charge recovery in Harbour District at 85.4% against 98%, as landscaping cost rises | Review landscaping rates and scope with the contractor | Director of Facilities |
| Receivables over 90 days at QAR 45.3 m against QAR 37.0 m, mostly in fourteen Seafront accounts | Chase those fourteen accounts | Chief Financial Officer |
| Treated sewage effluent (TSE) network loss at 9.3% against 8% | Pressure test the line between pump station 2 and Canal Quarter | Director of Facilities |
| Six of 125 October gas bills flagged for unusual use or a missing read | Hold those six; Finance approves the rest before any bill is issued | Chief Financial Officer |
Every figure traced to its source.
One definition per KPI, and a route from any number down to its records.
Who it's for.
Organisations that report every month on many buildings, assets or services.
Property developers and landlords
Service charges, receivables, leasing and resident experience in one scorecard.
Facilities and smart buildingsFacilities and district cooling operators
Work orders, contractor SLAs and metered utilities, with the field data behind each KPI.
Utilities and district coolingMulti-site operators
The same KPI definitions on every site. Footfall and space use come from occupancy sensors.
Occupancy and people countingFleets and mobile assets
Availability, utilisation and servicing for vehicles, buggies and marine craft, next to the rest of the portfolio.
Fleet telematics
Questions buyers ask.
Something else? Ask us during the free assessment.
Which systems does Quoriam business intelligence connect to?
Your ERP, your CAFM or CMMS, sales and leasing systems, contact centre apps and meter head-ends, plus any sensor already on the Quoriam platform. Manual figures arrive through controlled Excel templates, and each source shows when it last synced and whether its data is fresh.
Is Quoriam an alternative to Power BI?
Yes, and it covers much more. Power BI reports on data that has already been collected and prepared. Quoriam collects that data from your ERP, CAFM, meters and sensors, monitors it around the clock, explains what is changing through Quoriam AI, raises the work order and tracks each decision to an owner. Reporting is one part of what it does, and teams that like Power BI for reports can keep using it alongside.
What is a good Power BI alternative in Qatar?
It depends on what you need after the dashboard. Property, facilities, utilities, manufacturing and fleet operators choose Quoriam because it goes beyond reporting: it reads meter and sensor data directly, raises alerts and work orders, and gives every decision an owner. It is built and supported in Doha, runs on your own servers or on cloud hosted in Qatar, and works in Arabic and English. General-purpose tools such as Tableau, Qlik and Looker suit analyst teams that only need reports from a data warehouse.
How is Quoriam different from Power BI, Tableau or Qlik?
Those are reporting tools that draw charts from data your team has already prepared. Quoriam covers the whole path. It connects the sources, reads the meters and sensors, holds one definition for each KPI, monitors the readings continuously, explains what changed, and carries each number through to an approved action with an owner and a due date.
Can Quoriam work with Power BI, or do we have to replace it?
You can keep Power BI. Quoriam holds the KPI definitions and their source records, the field data from meters, sensors and work orders, and the follow-up on each decision. Power BI connects to the Quoriam API to pull the certified KPIs and their data into your existing reports. Quoriam sets this up for clients who want it.
Can business intelligence run on our own servers in Qatar?
Yes. Quoriam runs on your own servers or on cloud hosted in Qatar, chosen with your IT team. For comparison, Microsoft's on-premises option is Power BI Report Server, which is licensed through Fabric F64 or larger reserved capacity, eligible SQL Server core licences (version and Software Assurance conditions apply) or Premium P capacity (Microsoft Learn).
What hardware do we need?
None for the ERP and CAFM side, which connects to systems you already run. Utility and asset KPIs need meters, sensors or trackers: Quoriam reads the ones you have, and we fit the rest, often on one shared LoRaWAN network so that each new use only needs sensors. See sub-metering and predictive maintenance.
Can it produce our board pack and monthly reports?
Yes. The monthly board pack is assembled from the scorecard, opens in Board mode and exports to PDF or PowerPoint. Commentary drafted by Quoriam AI stays marked as a draft until someone approves it. Scheduled briefs arrive in the platform or by email.
How does Quoriam AI make recommendations?
It proposes only from a list of actions you have approved, and shows the evidence, expected impact, confidence and a suggested owner for each. A person approves, edits or dismisses every one, and nothing leaves the platform without that approval.
Where is the data hosted, and who can see what?
Access is role-based, with roles mapped to your directory groups, so each person sees the views for their role. HR figures reach Quoriam as counts and rates only, with no names, salaries or personal details, and detail below department level stays with HR.
What does it cost, and how soon do we see a first dashboard?
It depends on how many sources and KPIs you start with, and you can add sources in steps. The free three-week assessment ends with a scope and a fixed price.
Related.
Business intelligence runs on the Quoriam platform, beside the solutions that supply its field data.
- Platform
The Quoriam IoT platform connects sensors, PLCs, meters and business systems in Qatar, then turns readings into alerts, work orders and reports.
- Smart metering and sub-metering
Meter electricity, water and chilled water by tenant or line, and settle every bill on evidence.
- Predictive maintenance
Catch bearing wear, overheating and imbalance weeks before a pump, motor or chiller fails.
- Fleet telematics
Track vehicles, fuel and driver behaviour, with servicing scheduled from the same data.
Start with the report you rebuild every month.
A free three-week assessment. We review the KPIs you report today and the systems behind them, then propose a first scorecard and where each figure will come from.
We take on two assessments a month.Quoriam is designed to pay back within six months. How we calculate payback