







- Home
- Solutions
- Factory intelligence
- OEE monitoring
OEE Monitoring Software in Qatar
Availability, performance and quality calculated live from the PLCs on your lines, by machine, shift and SKU, with the six big losses behind every point you lose.
Last updated
What is OEE monitoring software?
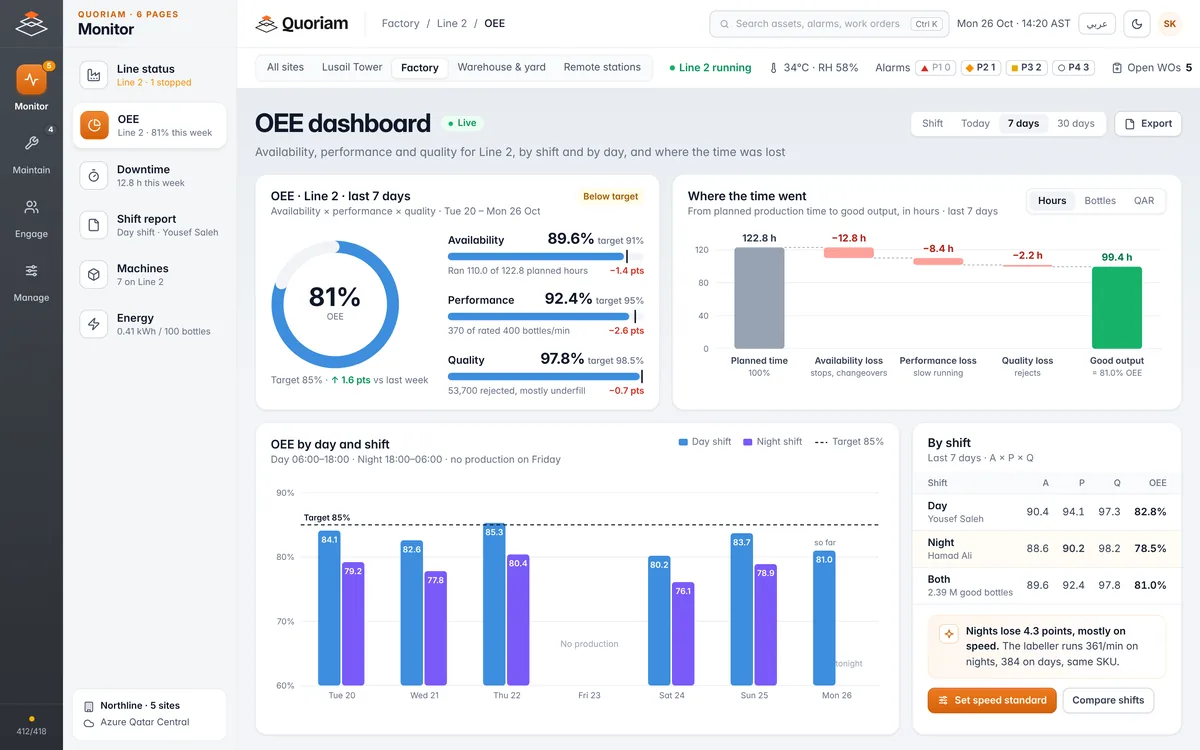
OEE monitoring software calculates overall equipment effectiveness while the line runs, from the run state and counts in each machine's PLC. It splits every lost minute into availability, performance or quality loss, by shift and SKU, so you see where capacity goes during the shift instead of in a spreadsheet the next morning.
The formula and a worked example are on the factory intelligence page. This page covers measuring OEE well: where the numbers come from, and the settings that quietly flatter a line.
Shift-end OEE
Typed up from the shift sheet. Short stops and slow running never reach it.
One machine's counter
Accurate for that machine. Blind to the time it spends starved or blocked by its neighbours.
Live OEE from the PLCs
Every machine's state and counts on one timeline for the line, updated as it runs.
The six big losses, and how each is recorded.
Every lost point of OEE falls into one of six losses, each recorded from the machine.
| Loss | OEE factor | How Quoriam records it |
|---|---|---|
| Equipment failure | Availability | A stop longer than the minor-stop threshold, with its reason from the line tablet |
| Setup and adjustments | Availability | Changeover time from the last good unit of one SKU to the first good unit of the next |
| Idling and minor stops | Performance | Short stops below the threshold you set, coded automatically |
| Reduced speed | Performance | Actual rate against the ideal rate for the SKU, while the machine runs |
| Process defects | Quality | Rejects during steady running, from reject counters and inspection systems |
| Reduced yield | Quality | Rejects from start-up, often after a changeover, until running is steady |
Loss definitions and their OEE factors: OEE.com, the six big losses. OEE.com describes minor stops as typically a minute or two, well under five minutes and needing no maintenance; your threshold is agreed with you, usually two minutes.
Four settings that make OEE look better than it is.
The formula is simple. The inputs are where OEE goes wrong.
| Setting | What goes wrong | What we do |
|---|---|---|
| Ideal cycle time from the budget | A 'standard' speed slower than the machine can run inflates performance and hides slow running | Ideal rate per SKU from the nameplate or the fastest sustained run, never lowered for machine age |
| Time left out | Excluding changeovers, cleaning or handovers from planned time makes availability look better | Only breaks and no-order time excluded; everything else counts |
| Micro-stops missed | Stops of a few seconds never reach a log sheet, so performance loss has no cause | Every stop from the PLC, with short ones grouped and coded |
| OEE on the wrong machine | A machine that is starved or blocked shows its neighbours' losses as its own | OEE on the constraint, with starved and blocked time shown separately |
Ideal cycle time and excluded time: OEE.com, Practical OEE.
How it works.
Connect
The edge gateway reads run state, good and reject counts and the running SKU from each machine's PLC, read-only. See PLC data connectivity.
Set the ideal
We load the ideal rate for each SKU on each machine, and your shift calendar with its breaks.
Calculate
OEE updates as the line runs, for the shift so far, the day and the week, split by shift and SKU.
Act
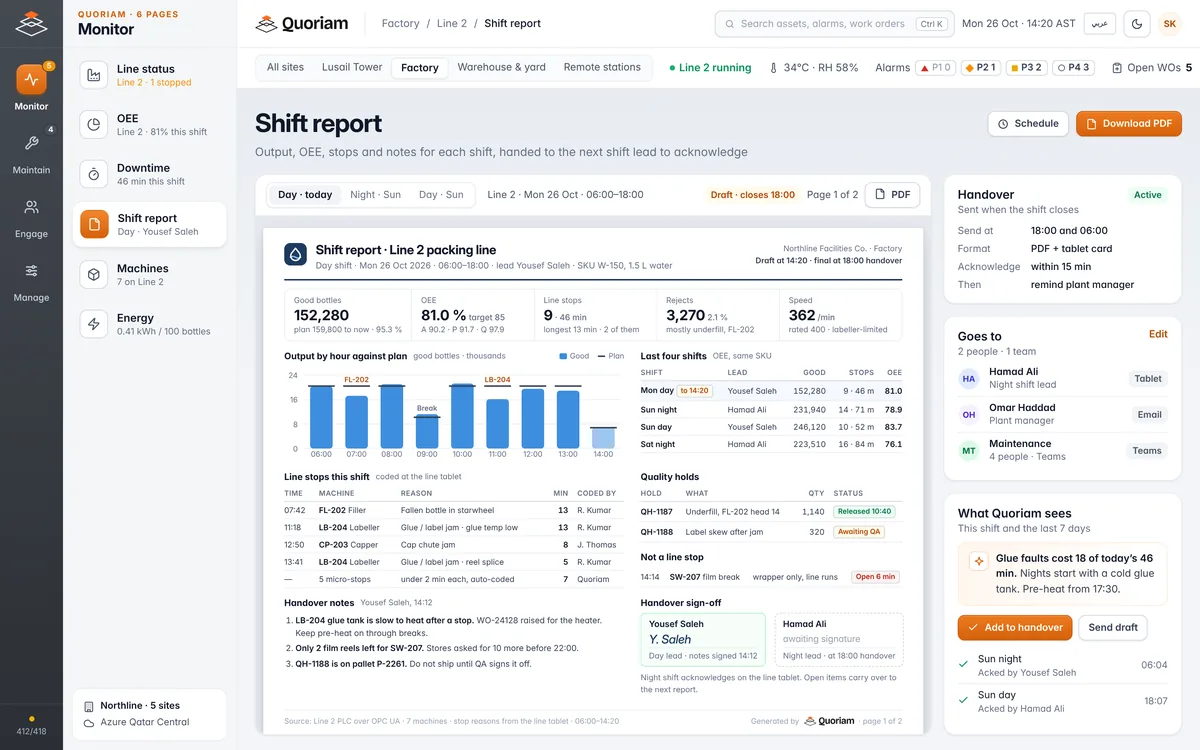
When the constraint slows, the shift lead sees which machine and which loss while there is time to recover.
System view
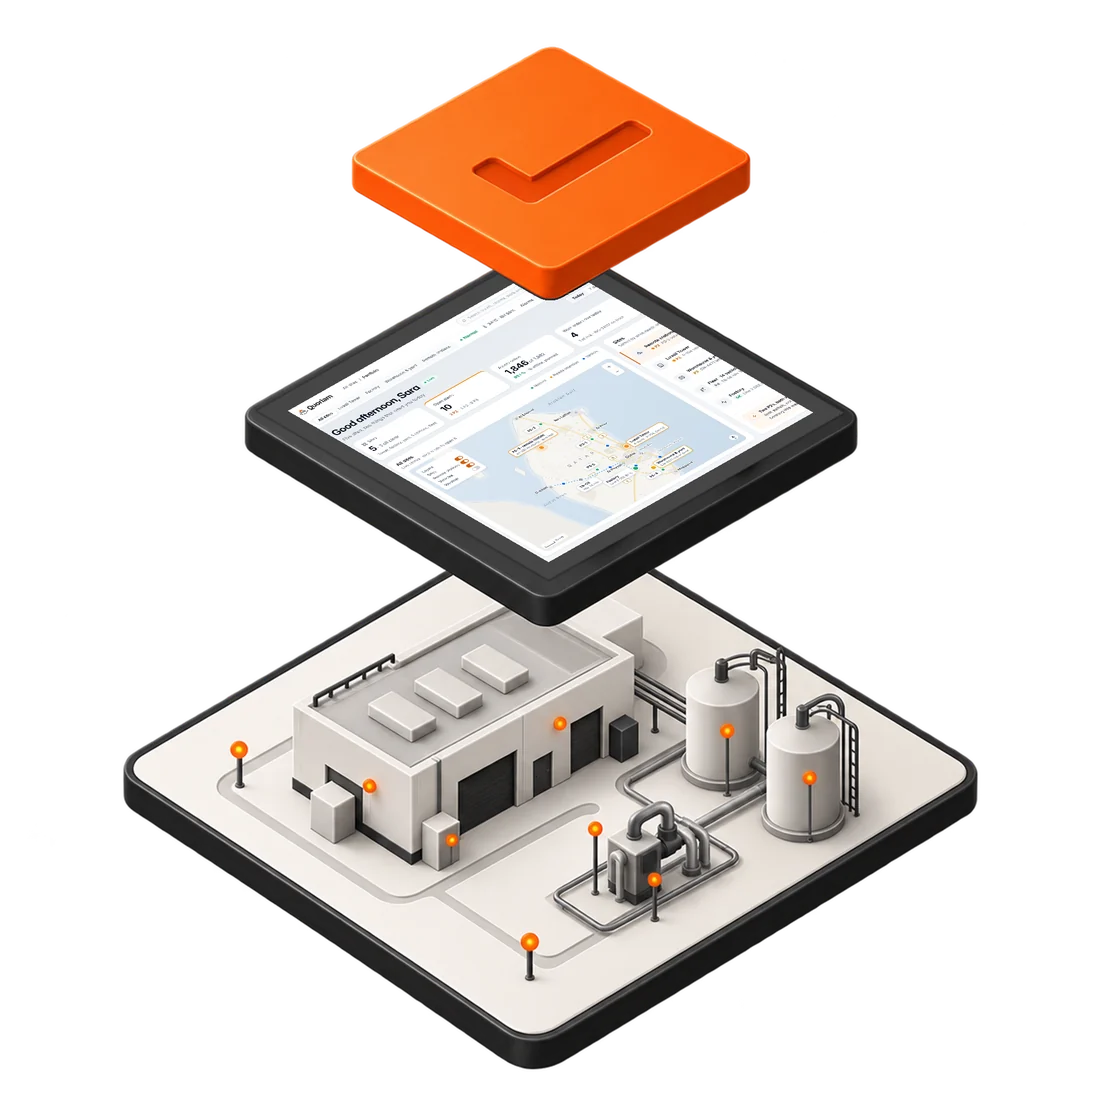
For IT, OT and security reviewers: where the data goes, and how.
- On the lineMachine PLCs, reject counters and count sensors where there is no PLC
- At the edgeQuoriam Edge QE35 reading PLCs, read-only
- NetworkPlant network or cellular, encrypted and kept apart from the control network
- Quoriam platformOn your premises or cloud hosted in Qatar
- Your team and systemsLine boards, shift reports, alerts to shift leads, data to your ERP
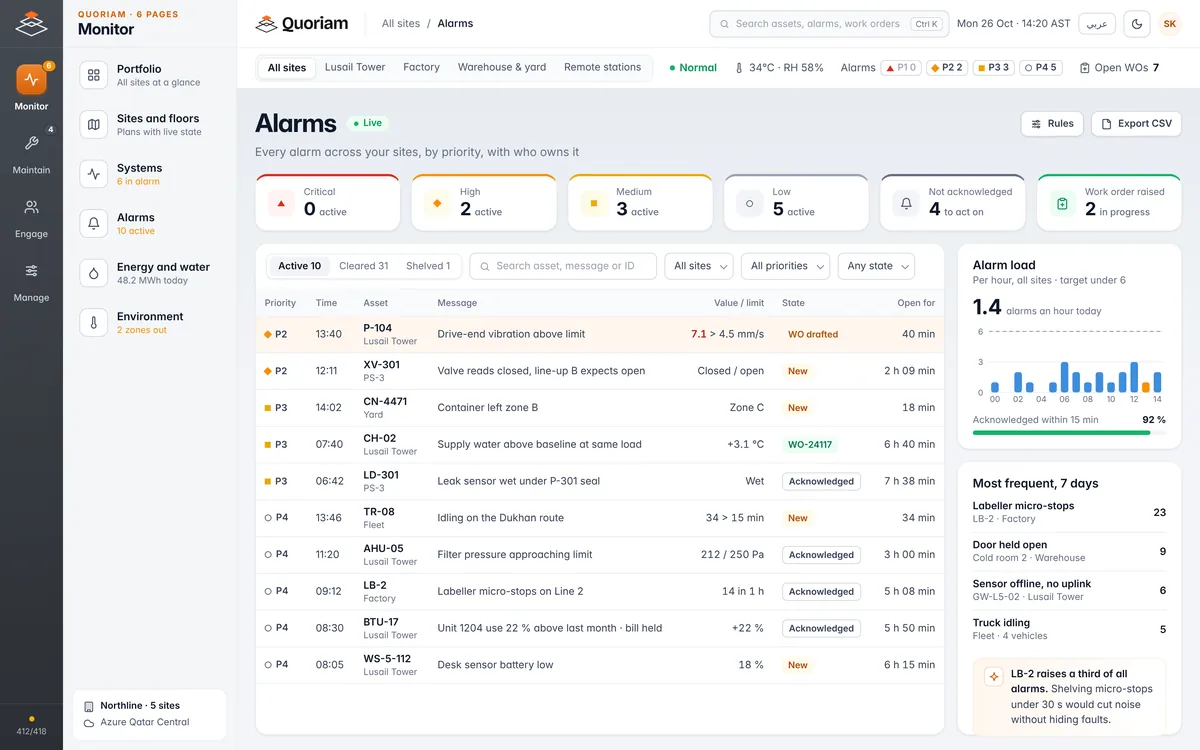
What your team sees.
The week's OEE, the shift that just ended, and the stops that keep coming back.
Or just ask.
Quoriam AI answers in plain language and turns the answer into an action.
Where it's used in Qatar.
Wherever a few points of OEE are worth more than a new machine.
Food and beverage
Water, juice and dairy bottling lines, where the filler and labeller set the pace.
ManufacturingPackaging and plastics
Moulding, extrusion and converting lines with many short stops.
Building materials
Block, pipe and precast plants in Mesaieed, where presses and kilns set the pace.
Personal care and pharmaceuticals
Filling and packing lines with frequent SKU changes.
Questions buyers ask.
Something else? Ask us during the free assessment.
What is a good OEE score?
85% is often called world class, from 90% availability, 95% performance and 99% quality, but OEE.com notes most manufacturers are closer to 60% and warns against comparing different processes. The useful target is your own line's baseline plus the losses you can remove, which a month of accurate data shows.
How is OEE monitoring different from a spreadsheet?
A spreadsheet is filled in after the shift from memory, so short stops and slow running are missing and the number comes out high. OEE monitoring reads every stop and count from the PLC as it happens, so the shift lead can act during the shift.
How should the ideal cycle time be set?
From the fastest rate the machine can sustain for that SKU: the nameplate rate, or a time study of its best sustained run. Budget or standard rates are slower, which inflates performance and hides slow running. If a machine regularly runs faster than its ideal rate, that rate is set too low.
What hardware do we need?
An edge gateway on the plant network to read the PLCs, a tablet at each line for stop reasons, and count sensors only on machines with no PLC to read. One gateway usually serves a line or a hall. The free assessment lists the hardware for your plant.
Which PLCs can it read?
Siemens, Rockwell, Schneider, ABB, Mitsubishi and Omron controllers, among others, over OPC UA, Modbus TCP or EtherNet/IP. The connection is read-only, so the control program stays as it is. PLC data connectivity covers protocols and network security in detail.
Does it count micro-stops?
Yes. Every stop is read from the PLC, however short. Stops under the threshold you set, usually two minutes, are coded automatically as minor stops and count as performance loss. When they bunch up on one machine, such as 14 in an hour, Quoriam raises an alarm.
What does OEE monitoring cost?
It depends on how many lines and machines you connect and how each one connects. Most plants start with one line as a pilot, then add lines once the numbers are trusted. The free three-week assessment ends with a scope and a fixed price.
Related.
OEE monitoring is part of factory intelligence on the Quoriam platform.
- Factory intelligence
Live line status, OEE and downtime reasons from the PLCs you already run.
- Downtime tracking
Every stop logged with its reason, so the biggest losses get fixed first.
- PLC data connectivity
Read Siemens, Rockwell and other PLCs over OPC UA, without touching the control logic.
- Predictive maintenance
Catch bearing wear, overheating and imbalance weeks before a pump, motor or chiller fails.
Measure the OEE your line really runs at.
A free three-week assessment. We review your lines, their PLCs and today's OEE figures, then show you which losses the numbers are hiding.
We take on two assessments a month.Quoriam is designed to pay back within six months. How we calculate payback