



- Home
- Industries
- Utilities and district cooling
District Cooling and Utility Metering in Qatar
BTU metering, customer billing, plant health and leak checks for district cooling providers, master developers and utility operators in Qatar, on one platform alongside your SCADA.
Last updated
What is district cooling metering?
District cooling metering measures the chilled water energy each building or tenant takes from the network, using a BTU meter read remotely. Quoriam adds the plant and the network around it: chiller and pump health, water and night-flow leak checks, and peak load against contracted capacity, so every bill rests on a reading and losses show up early.
Qatar regulates district cooling as a utility. Under Law No. 19 of 2024, Kahramaa licenses anyone who builds or operates a district cooling system and sets service areas and technical standards (US Commercial Service). In May 2026 Kahramaa announced further decisions on service areas, network access and compensation (The Peninsula). The networks are large: Lusail's, run by Marafeq Qatar, was recognised in 2026 as the world's largest district cooling network, at 123.5 km (QNA).
Every network ends at a meter. In Lusail, Marafeq's district cooling sub-meter guideline asks for an ultrasonic sub-meter for each tenant, calculating energy to EN 1434 Class 2 and read over M-Bus into an AMR system. Quoriam reads those meters, the plant that makes the cooling and the network in between, read-only alongside the SCADA you already run.
What goes wrong.
What district cooling, utility and facilities teams in Qatar tell us before we start.
"Customers dispute the ton-hours on every invoice."
When a meter drops off the M-Bus loop or is read by hand, the bill rests on an estimate. Each estimate turns into a negotiation with the building owner, and the cash comes in late.
"We pay for water nobody can account for."
Water for cooling towers, risers and landscaping is paid for at the main meter. Without metering by zone and a night-time baseline, a slow leak looks like normal use for months.
"A chiller tripped at peak load in August."
The plant runs at its limit all summer. Fouled condenser tubes and worn pump bearings show in approach temperatures and vibration weeks before the trip.
Solutions for utilities and district cooling.
Start with metering, the plant or the remote network, and add the rest on the same platform.
 BTU-17 +22% on last month
Smart metering and sub-metering
Meter electricity, water and chilled water by tenant or line, and settle every bill on evidence.
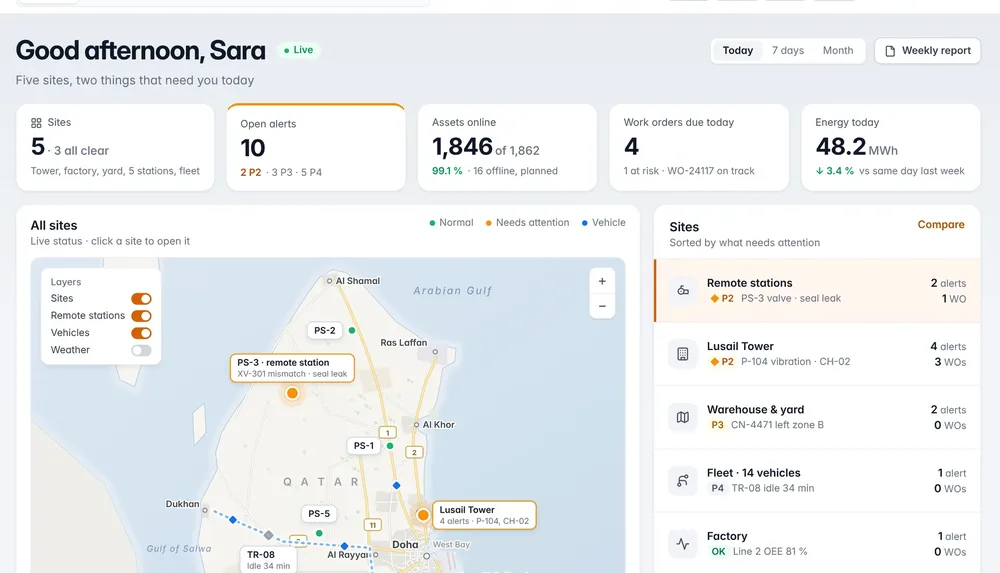
 PS-3 Pump 2 running, 4.2 bar
Remote operations monitoring
Valves, tanks, pumps and solar arrays across remote sites on one screen, with alarms on any change.
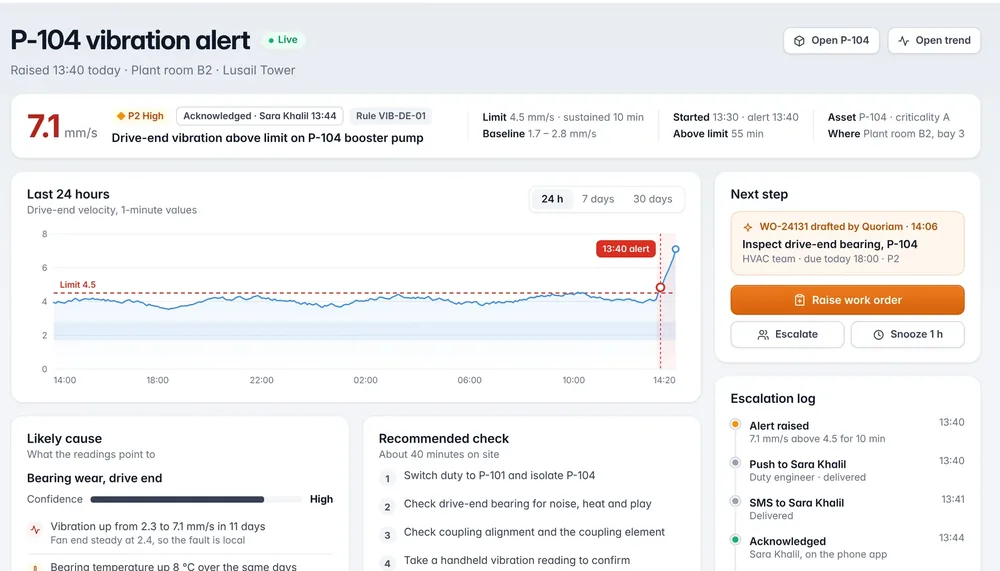
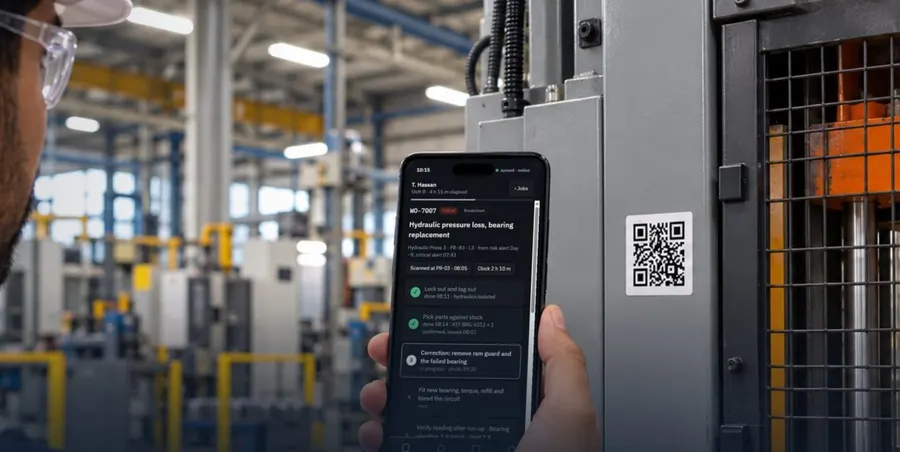
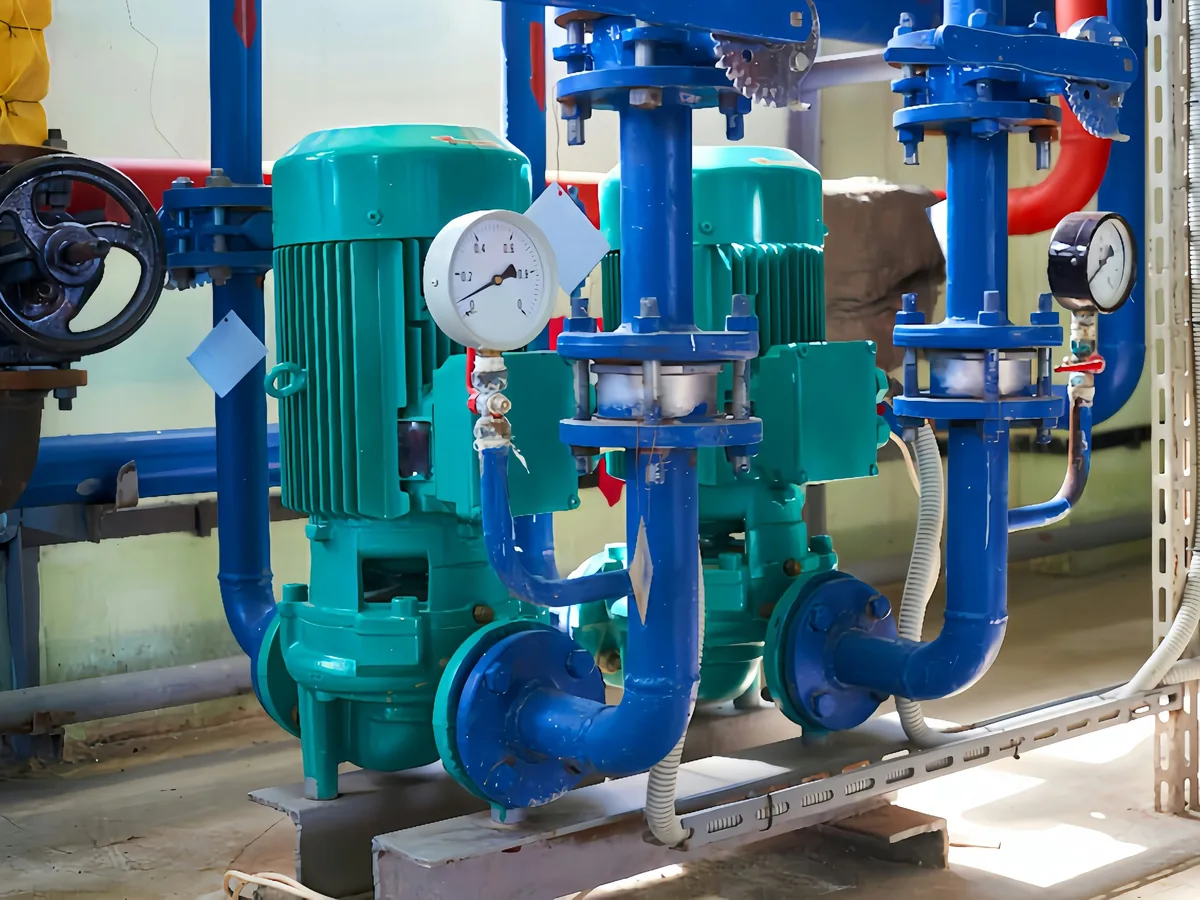 P-104 Vibration 7.1 mm/s
Predictive maintenance
Catch bearing wear, overheating and imbalance weeks before a pump, motor or chiller fails.
What we measure, from plant to tenant.
The points a district cooling scheme usually connects first, and what each one settles.
| Where | What we measure | What it settles |
|---|---|---|
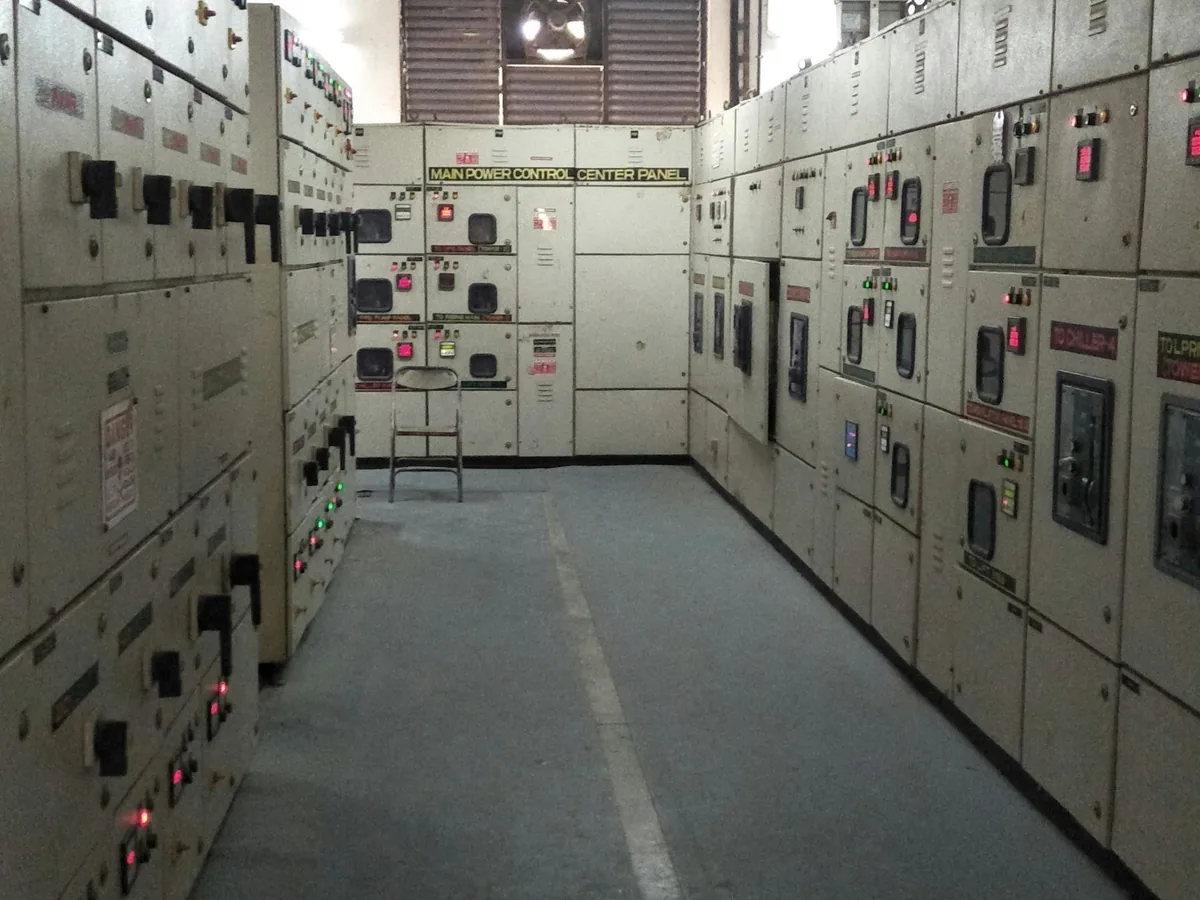
| Central plant | Chiller supply and return temperatures, condenser approach, kW per ton, vibration on pumps and fans | Efficiency and early warning of a trip |
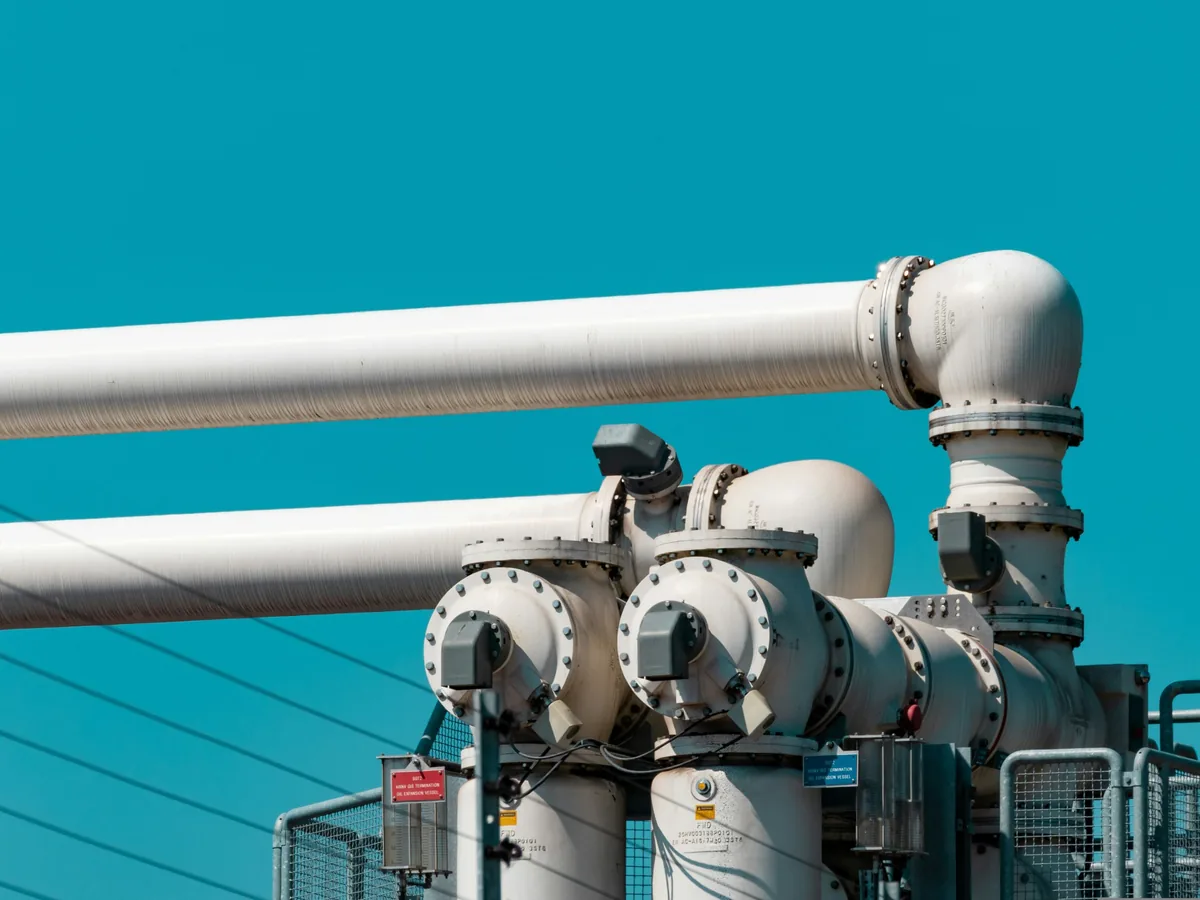
| Distribution pumps and network | Pressure, flow, pump current and vibration | Pump failures and pressure drops that point to a leak |
| Energy transfer station | Main BTU meter, primary and secondary temperatures, peak load in TR | Contracted capacity against the real peak, and a low ΔT |
| Tenant and building meters | BTU, electricity and water meters, read every few minutes | Bills built from readings, with an audit trail |
| Tanks and risers | Tank level, and water flow between 01:00 and 04:00 | Leaks caught by night flow |
A low ΔT matters because cooling energy is flow multiplied by temperature difference: when a building returns water too cold, the network pumps more water for the same cooling. See how a BTU meter works.
Where most schemes start.
The use cases that settle the most expensive arguments first.
- BTU and chilled water metering
Chilled water energy measured per tenant or building, read remotely and billed on evidence.
- Tenant billing
Monthly utility bills per tenant, built from meter readings with an audit trail.
- Water leak detection
Leak sensors and night-flow checks that catch a burst before the flood or the bill.
- Chiller monitoring
Compressor health and plant efficiency from sensors and the chiller's own controller.
Decisions the data makes possible.
Examples of what a reading leads to on a district cooling scheme. Illustrative, not project results.
| What Quoriam sees | The decision | What it saves |
|---|---|---|
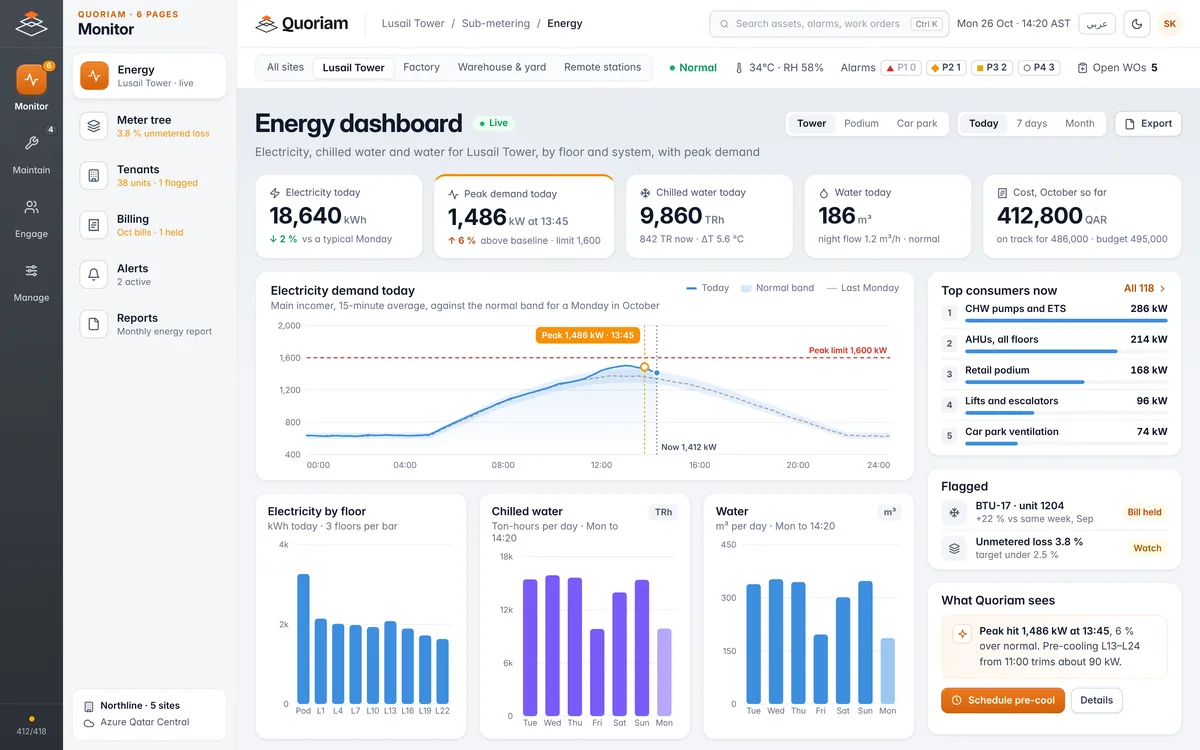
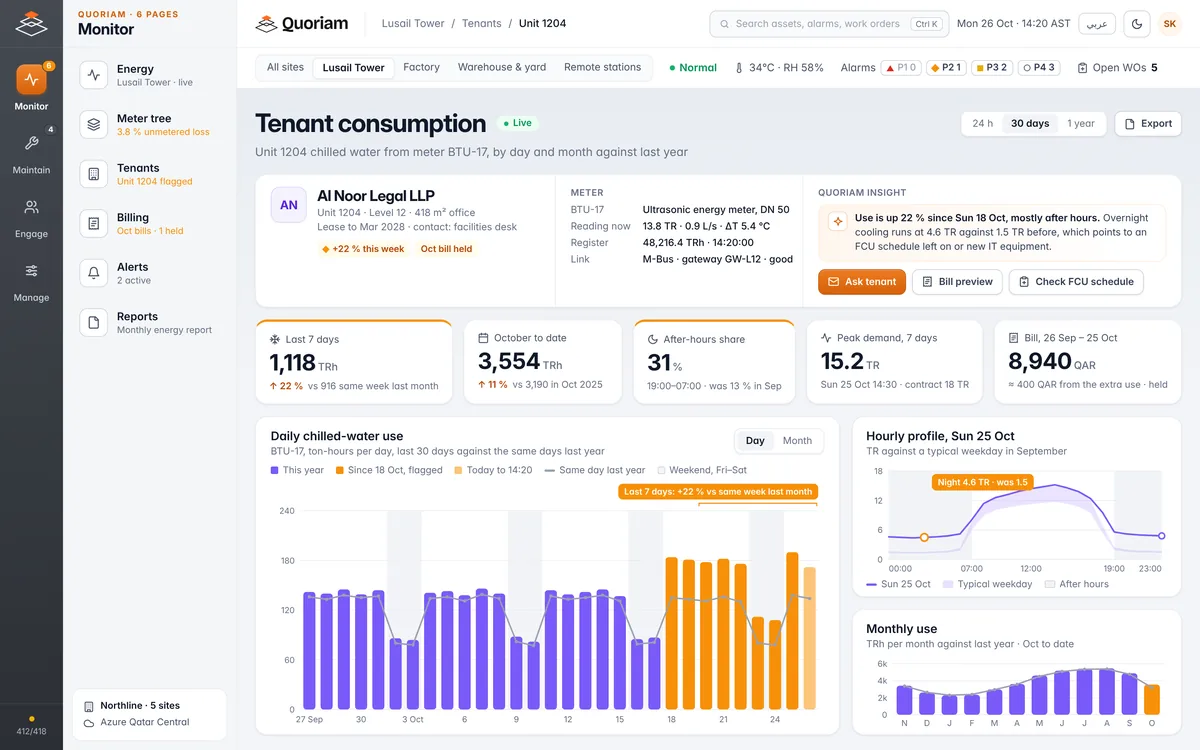
| Unit 1204 used 22% more chilled water than the same week last month, mostly after hours | Hold the bill and ask the tenant about the FCU schedule | A dispute and a credit note |
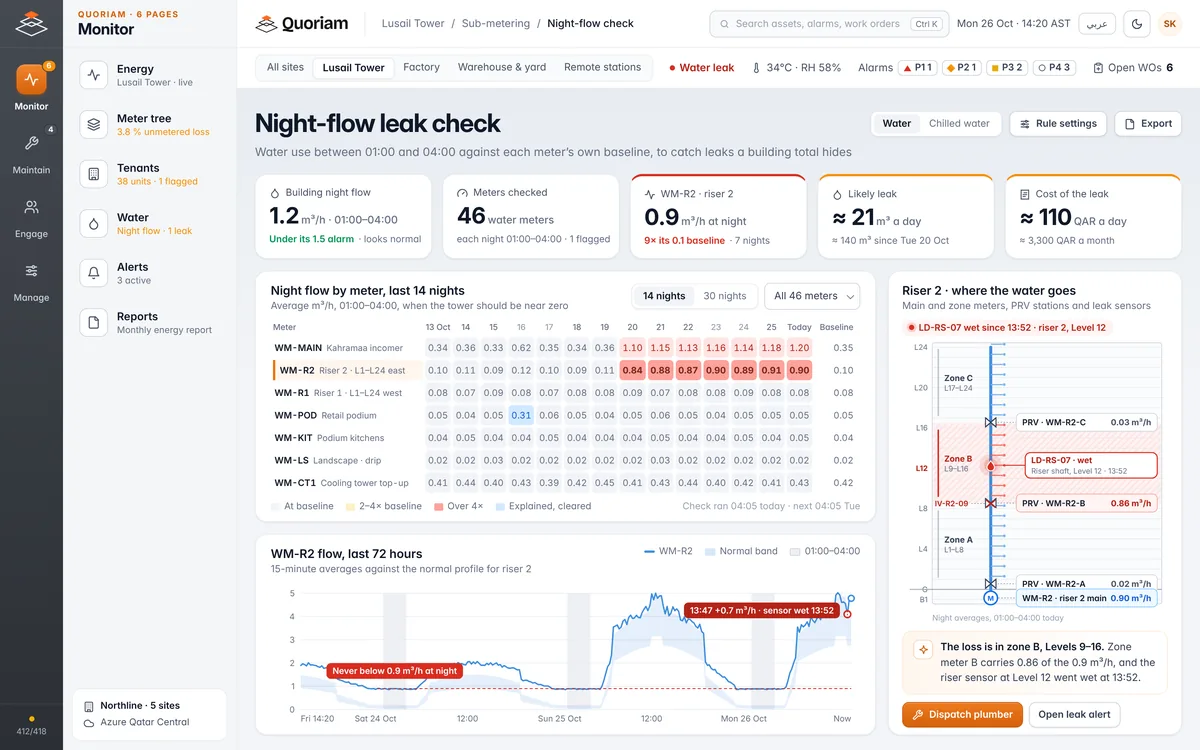
| Riser 2 water flow never drops below 0.9 m³/h at night | Send a plumber to zone B, Levels 9 to 16 | About 22 m³ of water lost every day |
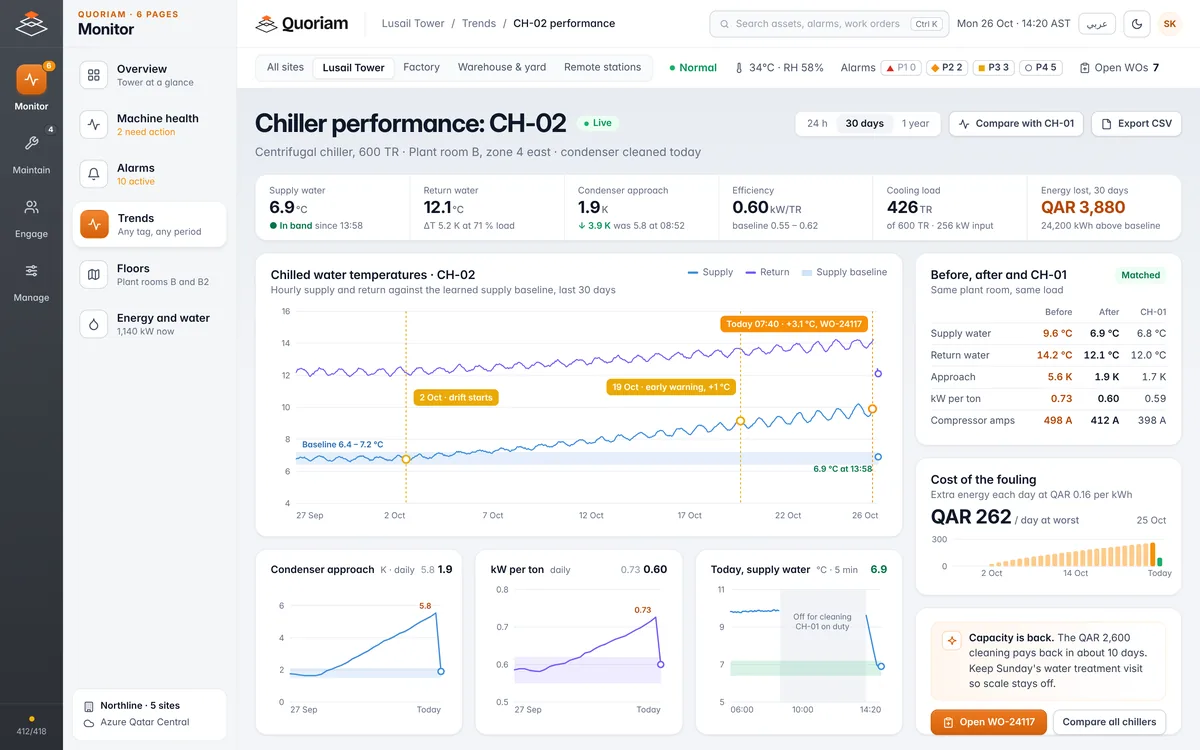
| CH-02 supply water 3.1 °C above baseline at the same load | Clean the condenser tubes at the next planned stop | A trip at peak load in August |
| A building's ΔT at the ETS well below design for a week | Check its control valves and bypasses with the building's facilities team | Pumping more water for the same cooling |
| Peak demand within 7% of a building's contracted capacity | Review the capacity at renewal with a year of peak data | Paying for capacity nobody uses, or running short in summer |
Quoriam is designed to pay back within six months. How we calculate payback
Quoriam AI in utilities and district cooling.
The digital energy and utilities engineer checks every meter against its neighbours and its own history.
Digital energy and utilities engineer
It finds meters that are drifting or under-reading by comparing each one with the meters around it and with its own past readings. Each month it reports the energy that was not billed and the revenue lost, meter by meter.
An example of how it works. It is illustrative and is not a project result.- The decision it supports
- Which meters to test, recalibrate or replace first.
- The outcome
- Lost revenue is measured each month, and the meters behind it are corrected in order of value.
What your team sees.
Leaks, plant and tenants on the same screens, each with the evidence behind the alert.
Questions buyers ask.
Something else? Ask us during the free assessment.
Can Quoriam read the BTU meters we already have?
Usually. Meters with an M-Bus, Modbus or pulse output are read directly, and an existing AMR system can be read where it exports its readings. We check every meter during the assessment before we quote. See BTU and chilled water metering.
How is district cooling billed in Qatar?
Bills typically combine a fixed capacity charge, based on the cooling capacity allocated to the property, with a consumption charge measured in refrigeration ton-hours (Qatar Living). Quoriam builds each customer's statement from their own meter and the rates in their agreement, and holds any bill that looks wrong for review.
Does Quoriam control the plant or the network?
No. Quoriam reads from your SCADA, BMS and chiller controllers, read-only, and adds alerts, work orders and billing on top. Control stays with the systems and operators you have today. Sites with no SCADA get meters, sensors and a gateway, and both kinds of site appear on the same screens.
How do you find leaks in a building or network?
Each water meter gets its own night-time baseline. When flow between 01:00 and 04:00 stays above it for several nights, Quoriam compares zone meters to narrow the leak to a riser and a group of floors, and leak sensors confirm it. See water leak detection.
How many meters and sensors do we need?
One BTU meter per customer or tenant you bill, a main meter at each energy transfer station, and sensors on the chillers and pumps that would hurt most if they failed. Existing meters usually cover most of it. The free assessment counts it for your scheme.
What does it cost?
It depends on the number of meters, how many need replacing and how much of the plant you monitor. The free three-week assessment ends with a meter survey, a scope and a fixed price. A pilot on one building or one plant comes next.
Find out where your cooling and water go.
A free three-week assessment. We survey your meters, plant data and billing, then show you the unbilled use, the leaks and the plant risks to fix first.
We take on two assessments a month.Quoriam is designed to pay back within six months. How we calculate payback