




- Home
- Solutions
- Smart metering and sub-metering
- HVAC and energy optimisation
HVAC Energy Optimisation in Qatar
Find the cooling you pay for and don't need: empty floors on full chill, schedules left on override, chillers drifting off their best. Then measure every change on the meter.
Last updated
What is HVAC energy optimisation?
HVAC energy optimisation means measuring what your cooling uses, finding the waste and fixing it: plant running for empty floors, setpoints colder than needed, schedules left on override and chillers drifting off their best efficiency. Each change is then checked on the meter against a weather-adjusted baseline, so you see the saving on the meter.
In Qatar, cooling is the load that matters. Kahramaa puts air conditioning at 60 to 70% of a home's electricity, recommends 24 °C as the setpoint for efficiency and comfort, and says each degree higher may save 2 to 5% (The Peninsula). Offices and towers run the same plant for longer hours, on empty floors too.
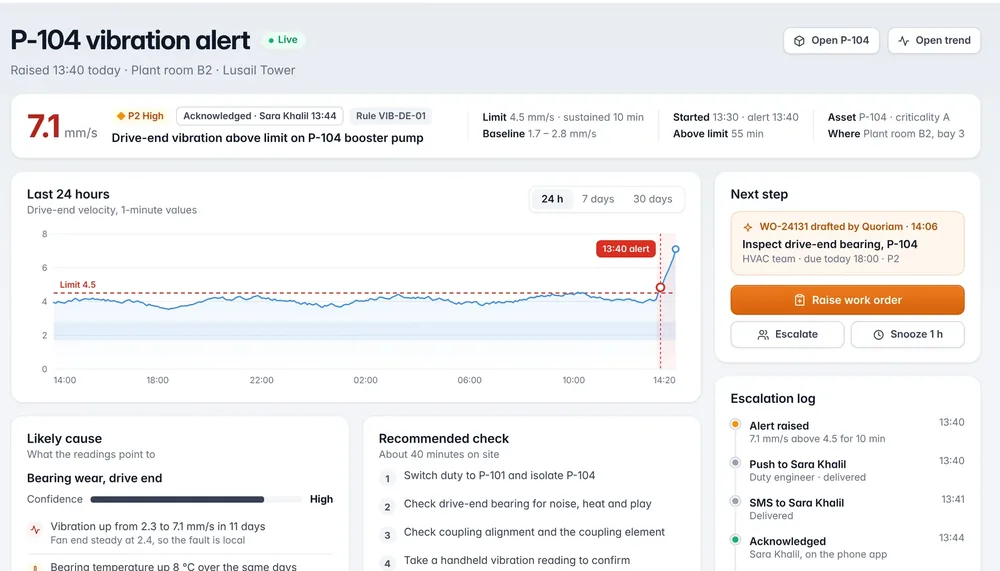
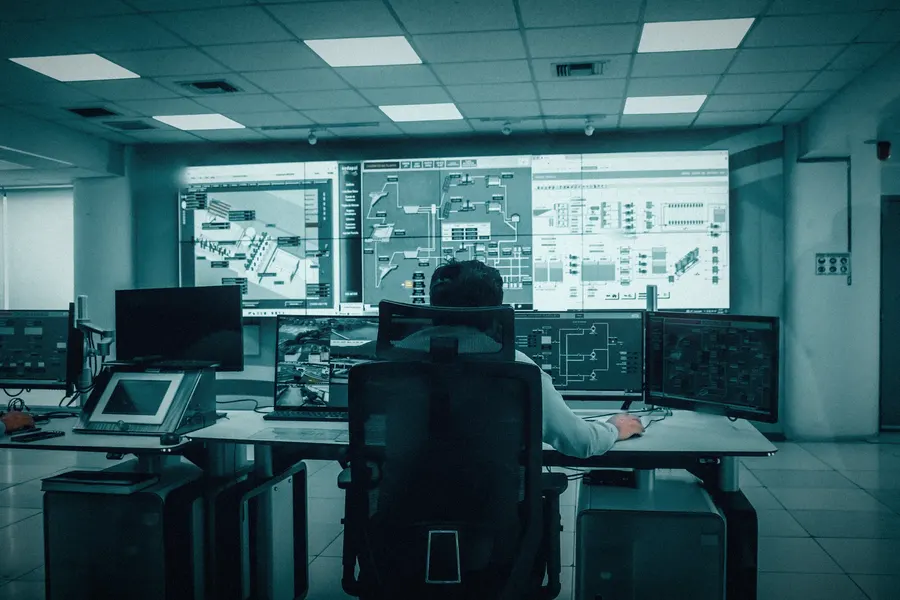
Optimisation starts with measurement. The sub-metering gives you the meters, occupancy monitoring tells you who is actually there, and the BMS tells you what the plant was told to do.
Where cooling energy goes to waste.
Six patterns that show up in the data, and the change that fixes each.
| Waste | What the data shows | What you change |
|---|---|---|
| Cooling empty space after hours | Chilled water or AHU power that stays high after the floor has emptied | Put the AHU or FCU schedule back to working hours |
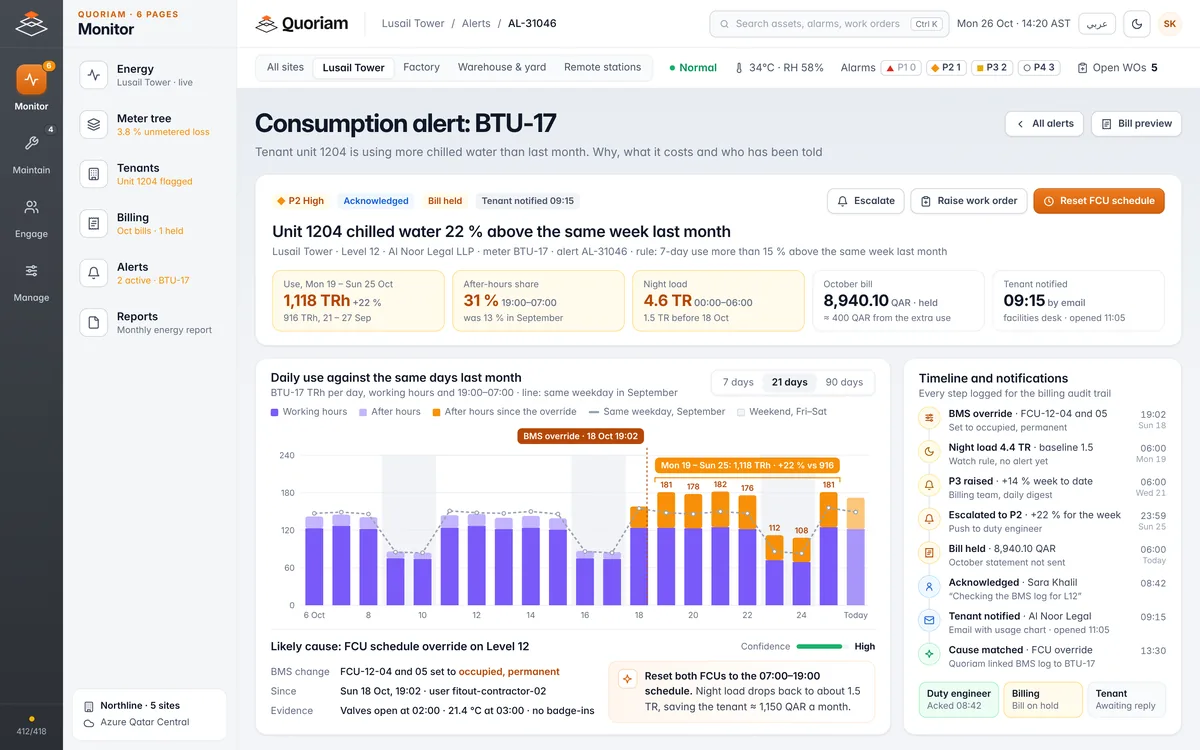
| A schedule override left on | A step up in night load on the day a BMS point was set to occupied | Reset the override and find out who set it |
| Setpoints colder than needed | Zones held below the agreed setpoint, often after tenant complaints | Raise setpoints in agreed steps, floor by floor |
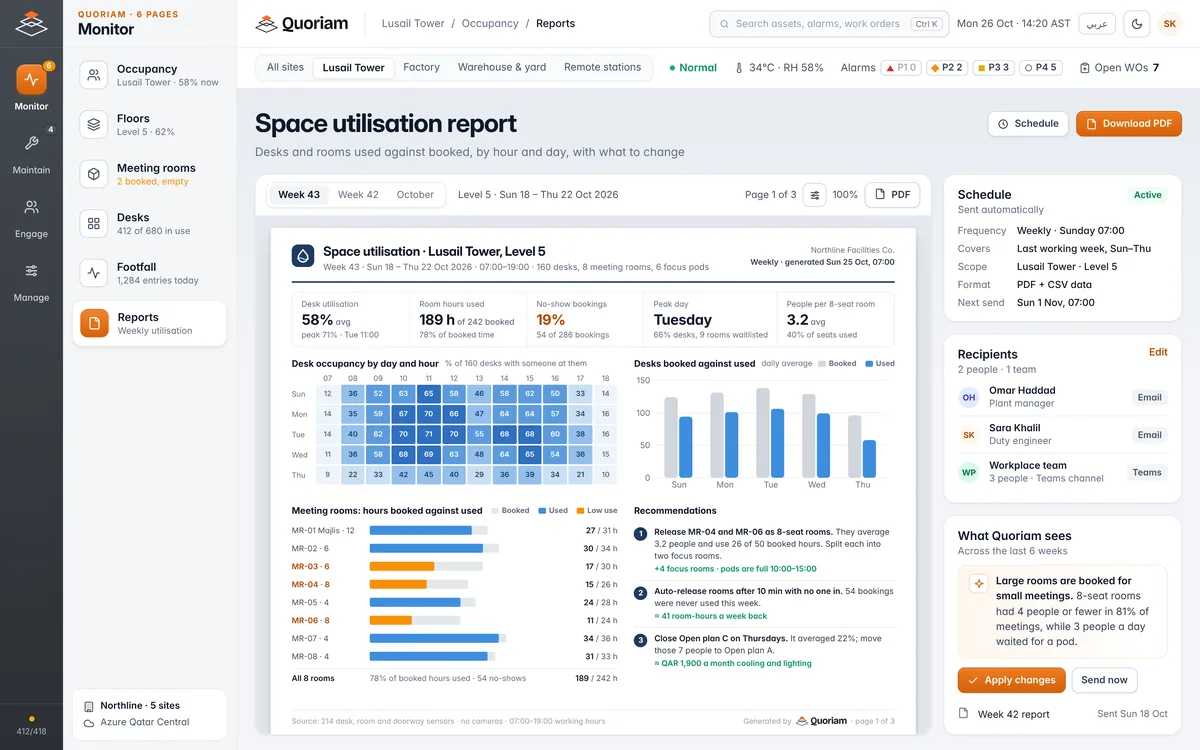
| Cooling zones nobody is using | Occupancy sensors show half-empty zones and booked rooms nobody uses | Consolidate zones and release unused rooms |
| Chiller drifting off its best | kW per ton and condenser approach rising at the same load | Clean the condenser or fix the cause, and confirm on the trend |
| Low ΔT across the building | Return water coming back cooler than design at the ETS or plant | Fix bypasses and control valves; district cooling contracts often set a ΔT requirement with a penalty (Grundfos) |
How savings are measured.
Cooling follows the weather, so a cooler month after a change can look like a saving it isn't. We compare against what the building would have used in the same weather.
| Step | What happens | Why |
|---|---|---|
| Baseline | Metered energy over a period with no changes, weekly or monthly | The building's own normal, before any change |
| Model | Energy = b × days + c × cooling degree days (CDD) | Splits the load into a fixed part and a weather part |
| Predict | Feed the reporting period's days and CDD into the model | What the building would have used without the change |
| Saving | Predicted energy minus metered energy | The saving in kWh or TRh, in that period's weather |
Method as set out by Degree Days.net, which recommends a year of data before and after. Shorter pilots compare matched weeks, and the report says which method was used. Occupancy changes are adjusted for separately.
How it works.
Measure
Read the BTU meter at the ETS or chiller plant, electricity on chillers, pumps and AHUs, zone temperatures and occupancy. BMS points are read over BACnet or Modbus.
Find the waste
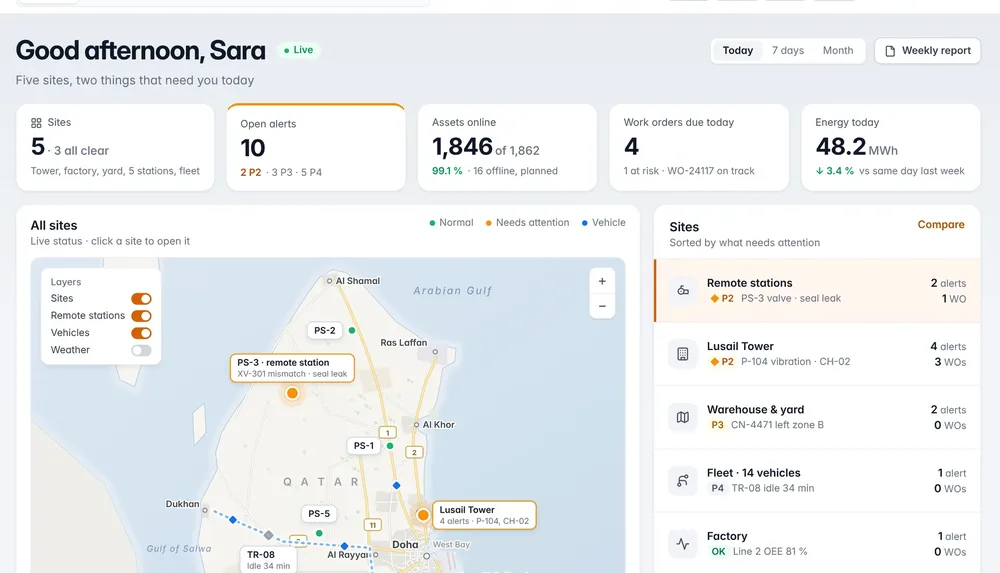
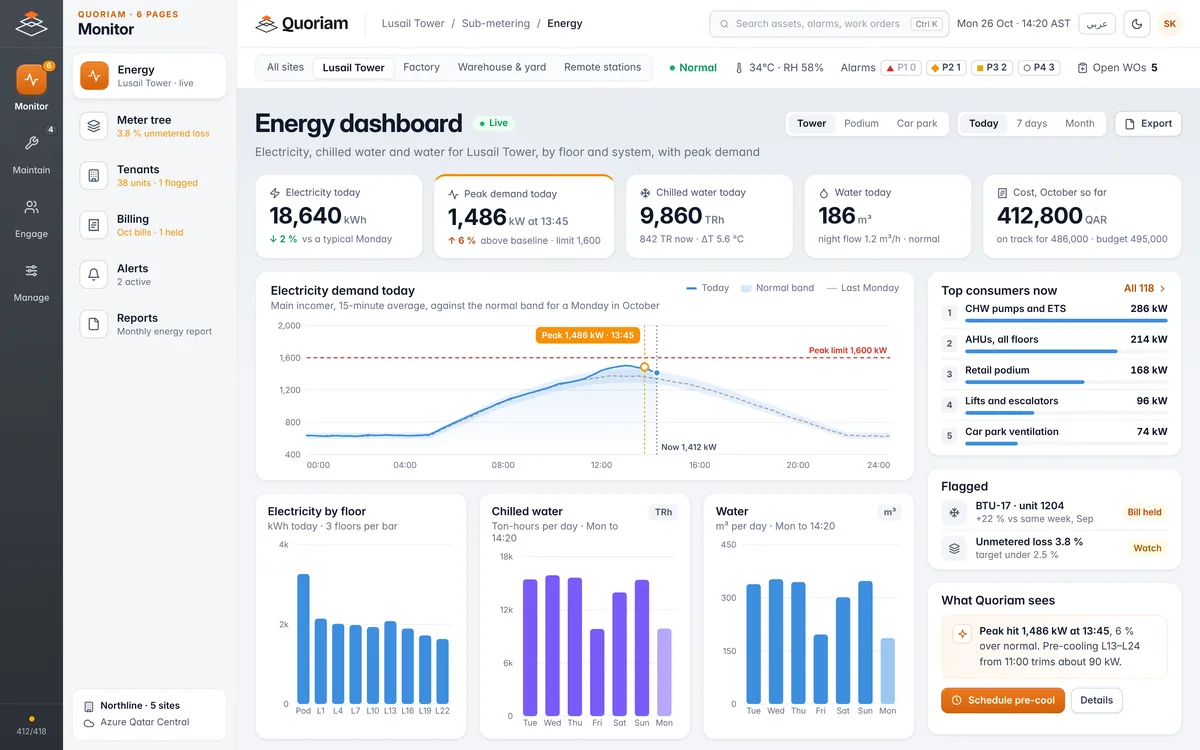
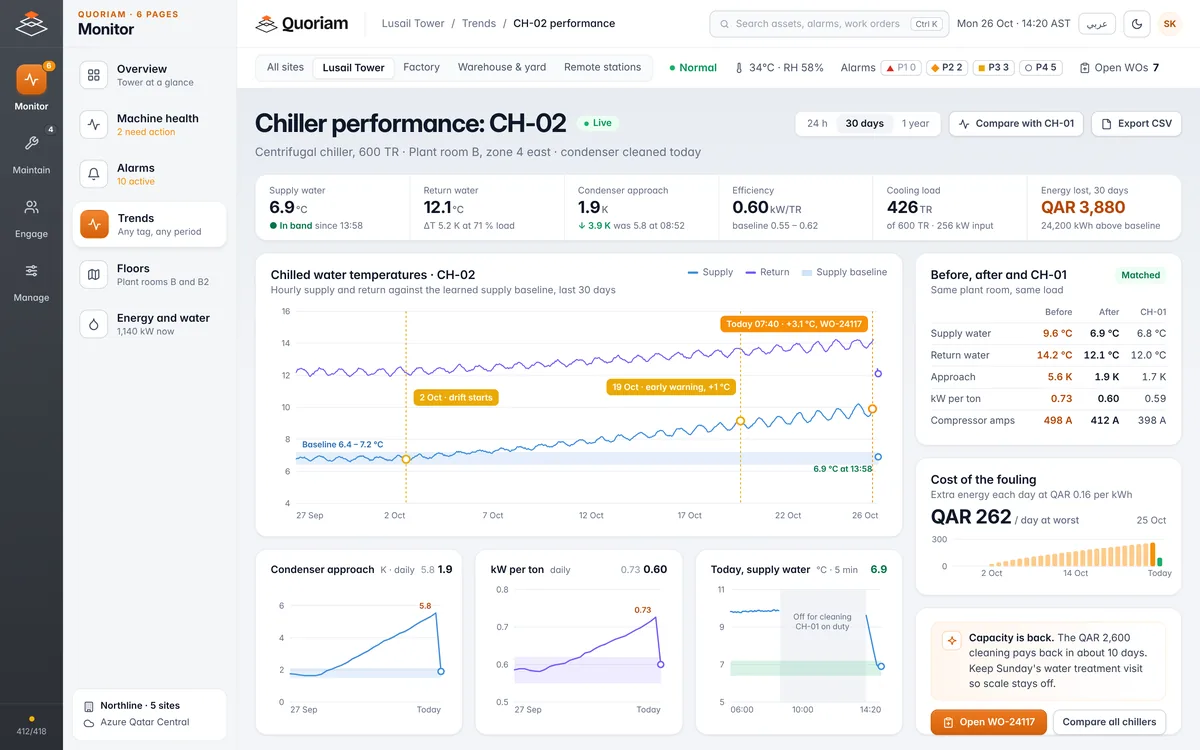
Quoriam compares schedules, setpoints and occupancy with consumption, hour by hour, and ranks what each pattern is costing you in QAR.
Change and verify
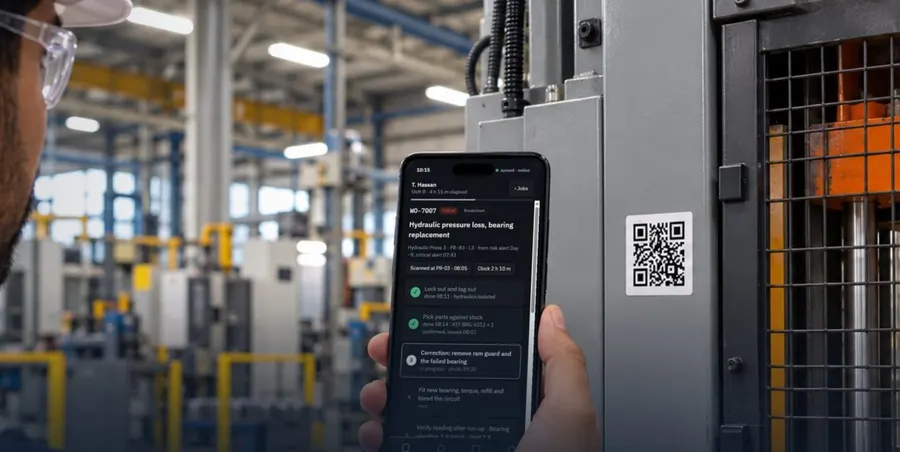
Your team or BMS contractor makes the change, with the evidence attached. Quoriam then measures before and after. Quoriam can also write the schedule or setpoint back to the BMS, once a named person approves it.

System view
For IT, OT and security reviewers: where the data goes, and how.
- In the buildingBTU and electricity meters, zone temperature and occupancy sensors
- In the plant roomGateway reading meters and the BMS over BACnet or Modbus
- NetworkSite LAN or cellular, encrypted and kept apart from the control network
- Quoriam platformOn your premises or cloud hosted in Qatar
- Your team and systemsAlerts, work orders and monthly savings reports
What your team sees.
The waste, its cost and the change that fixes it.
Or just ask.
Quoriam AI answers in plain language and turns the answer into an action.
Where it's used in Qatar.
Wherever cooling runs longer or colder than the people in the building need.
Office towers
Floors on full schedule with half the desks used, and tenants who override the BMS.
Facilities and smart buildingsDistrict cooled buildings
Capacity charges, ΔT requirements and consumption billed in ton-hours.
Utilities and district coolingMalls and hotels
Long opening hours, big common areas and kitchens with their own exhaust and make-up air.
Occupancy and people countingFactories and warehouses
Process cooling, cold rooms and offices on one site, each with its own schedule.
Manufacturing
Questions buyers ask.
Something else? Ask us during the free assessment.
How much energy can HVAC optimisation save?
It depends on how much waste your building has, so we measure it before promising anything. As a guide, Kahramaa says each degree higher on the setpoint may save 2 to 5% of energy use. The free assessment ranks the waste in your building in QAR, and the pilot measures what the changes actually saved.
What temperature should offices be set to in Qatar?
Kahramaa recommends 24 °C for efficiency and comfort (The Peninsula). Many buildings run colder because of complaints from a few zones. Zone temperatures and occupancy show where to raise setpoints first, and where a complaint is really an airflow or a balancing problem.
Does Quoriam control our BMS or chillers?
By default Quoriam reads the BMS and recommends the change; your team or contractor makes it. Quoriam can also write schedules or setpoints back to the BMS, and each change needs a named approval. The points it may write are agreed one by one with your facilities team first.
What hardware do we need?
Often less than you think. The BMS already holds schedules, setpoints and zone temperatures. We add a BTU meter at the ETS or plant if there isn't one, electricity meters on chillers, pumps and AHUs, and occupancy sensors on floors where the BMS has none.
How do you prove the savings?
Against a weather-adjusted baseline. We model the building's energy against cooling degree days before the change, predict what it would have used in the new period's weather, and compare that with the meter. A hot August can't hide a saving, and a mild October can't invent one.
What does it cost?
It depends on the meters and sensors already in place. The free three-week assessment ends with a ranked list of the waste, a scope and a fixed price.
Related.
HVAC and energy optimisation is part of sub-metering on the Quoriam platform.
- Smart metering and sub-metering
Meter electricity, water and chilled water by tenant or line, and settle every bill on evidence.
- BTU and chilled water metering
Chilled water energy measured per tenant or building, read remotely and billed on evidence.
- Chiller monitoring
Compressor health and plant efficiency from sensors and the chiller's own controller.
Find the cooling nobody needs.
A free three-week assessment. We review your meters, BMS data and occupancy, then rank the waste in QAR.
We take on two assessments a month.Quoriam is designed to pay back within six months. How we calculate payback