



- Home
- Solutions
- Remote operations monitoring
- Solar PV monitoring
Solar PV Monitoring in Qatar
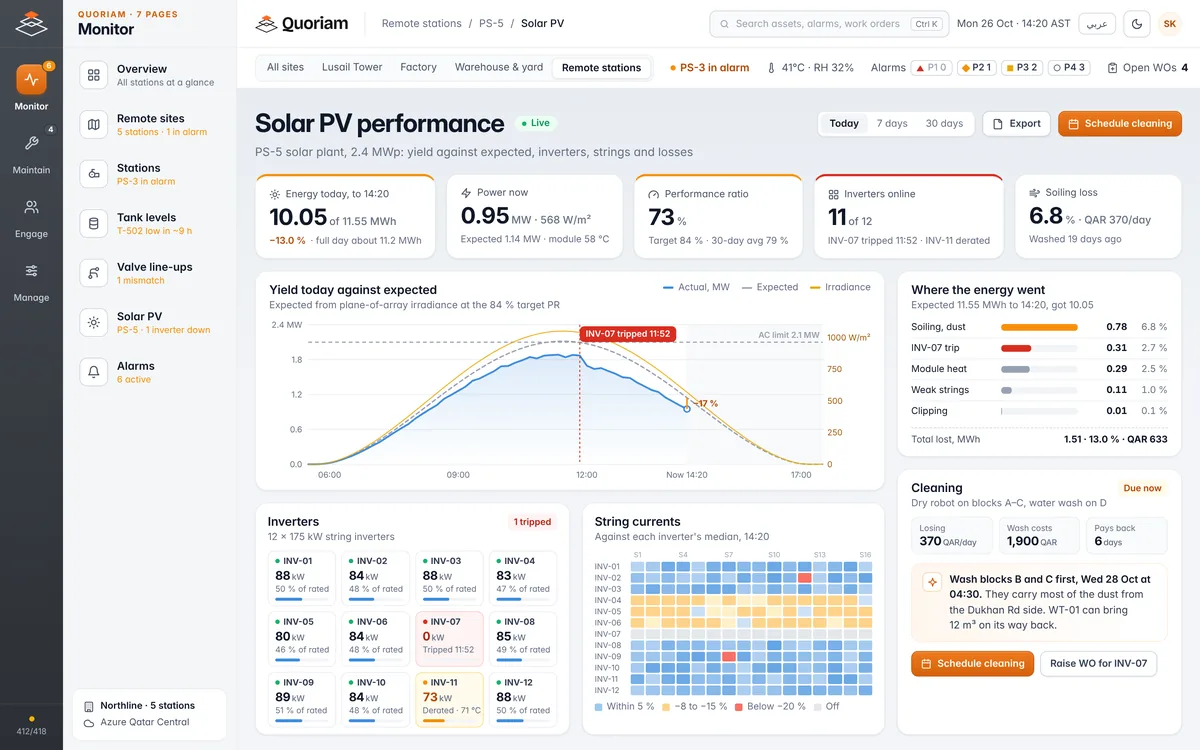
Yield against expected for every solar site, split into what caused each loss: a tripped inverter, a weak string, heat or dust.
Last updated
What is a solar monitoring system?
A solar monitoring system reads every inverter and string at a PV plant and compares the energy produced with what the measured sunlight says it should be. The gap is split into causes: tripped inverters, weak strings, module heat and dust. In Qatar, where dust settles fast, it also tells you when a wash pays back.
An inverter portal tells you what each inverter made. A solar monitoring system adds what it should have made, from the irradiance on the plane of the modules, so a loss shows up in megawatt-hours and riyals. Quoriam reads your solar sites alongside the rest of your remote sites, so a trip at a solar-powered borehole shows in the tank it feeds.
Dust is the loss that keeps growing. At QEERI's outdoor test facility in Qatar, soiling cost 0.41% of daily energy production per day on average, with significantly higher rates in winter than in summer.
Where the energy goes.
The losses a solar monitoring system separates, as the PS-5 screen shows them.
| Loss | What the data shows | What you do |
|---|---|---|
| Inverter trip | Output falls to zero and its strings go dark; INV-07 tripped at 11:52 | Reset or repair, with a work order raised from the alarm |
| Heat derating | An inverter capped below its peers while hot; INV-11 derated at 71 °C | Check cooling, filters and ventilation |
| Weak strings | String current 8% or more below its inverter's median | Inspect connectors, fuses and modules on that string |
| Soiling | The gap to expected grows evenly across the plant, day by day, and resets after a wash | Wash when the money lost each day outweighs the cost |
| Module heat | Output lower on hot afternoons, in line with module temperature | Nothing to fix, so it stays out of the fault list |
Performance ratio, by the standard.
IEC 61724-1 defines performance ratio as the final yield divided by the reference yield. Because it divides by both plant size and sunlight, it compares plants of any size.
| Term | Definition | PS-5, 2.4 MWp |
|---|---|---|
| Final yield | AC energy out divided by the plant's rated DC power, in kWh/kWp | 10.05 MWh ÷ 2.4 MWp ≈ 4.2 kWh/kWp |
| Reference yield | Irradiation in the plane of the modules divided by the 1,000 W/m² reference irradiance, in hours | About 5.73 h |
| Performance ratio | Final yield divided by reference yield | 73%, against an 84% target |
PR = Yf ÷ Yr = (E ÷ P0) ÷ (H ÷ Gref). Expected energy at the 84% target is 2.4 MWp × 5.73 h × 0.84 ≈ 11.55 MWh, about 1.5 MWh (13%) more than the 10.05 MWh produced. Sources: Hukseflux, how to calculate PV performance ratio, citing IEC 61724-1; DNV SolarFarmer, performance ratio for the 1,000 W/m² reference.
How it works.
Connect
Read each inverter and the plant meter over Modbus, and fit an irradiance sensor in the plane of the modules and a module temperature sensor where the plant has none.
Model the plant
Enter the DC capacity per inverter, the strings and the target performance ratio, so Quoriam can work out what each part of the plant should produce.
Split the losses
Every few minutes the gap to expected is divided into trips, derating, weak strings, heat and soiling, each in MWh and QAR.
Act
A trip raises an alarm and a work order. Soiling builds into a cleaning plan, with the blocks that lose most washed first.
System view
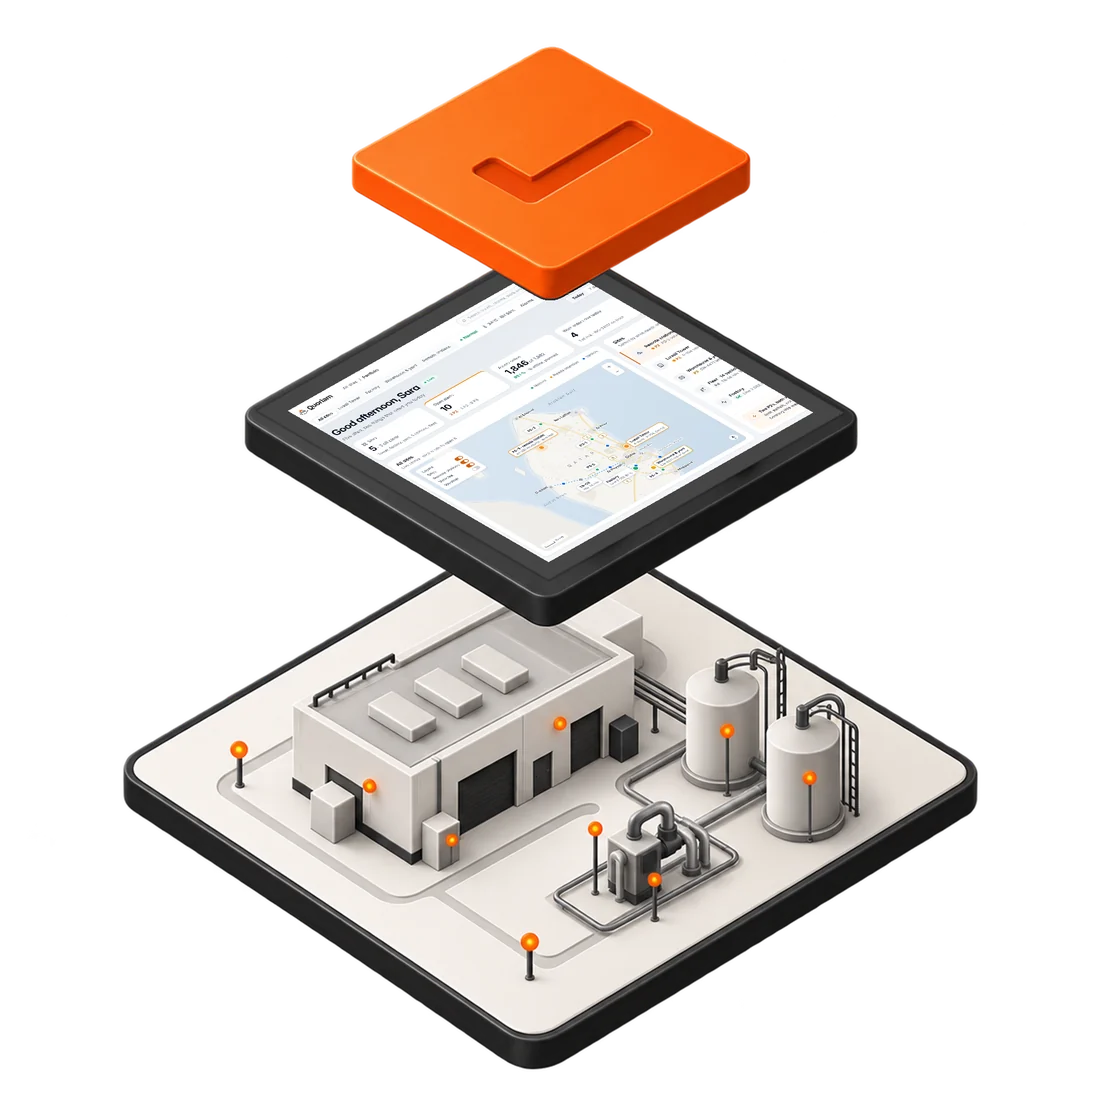
For IT, OT and security reviewers: where the data goes, and how.
- At the arrayInverters, plant meter, plane-of-array irradiance and module temperature
- At the plantQuoriam Edge gateway or the plant's data logger, over 4G or fibre
- NetworkCellular, fibre or site LAN, encrypted and kept apart from the control network
- Quoriam platformOn your premises or cloud hosted in Qatar
- Your team and systemsApp, SMS and email alarms; work orders and cleaning plans
What your team sees.
The solar plant in the context of the sites it powers.
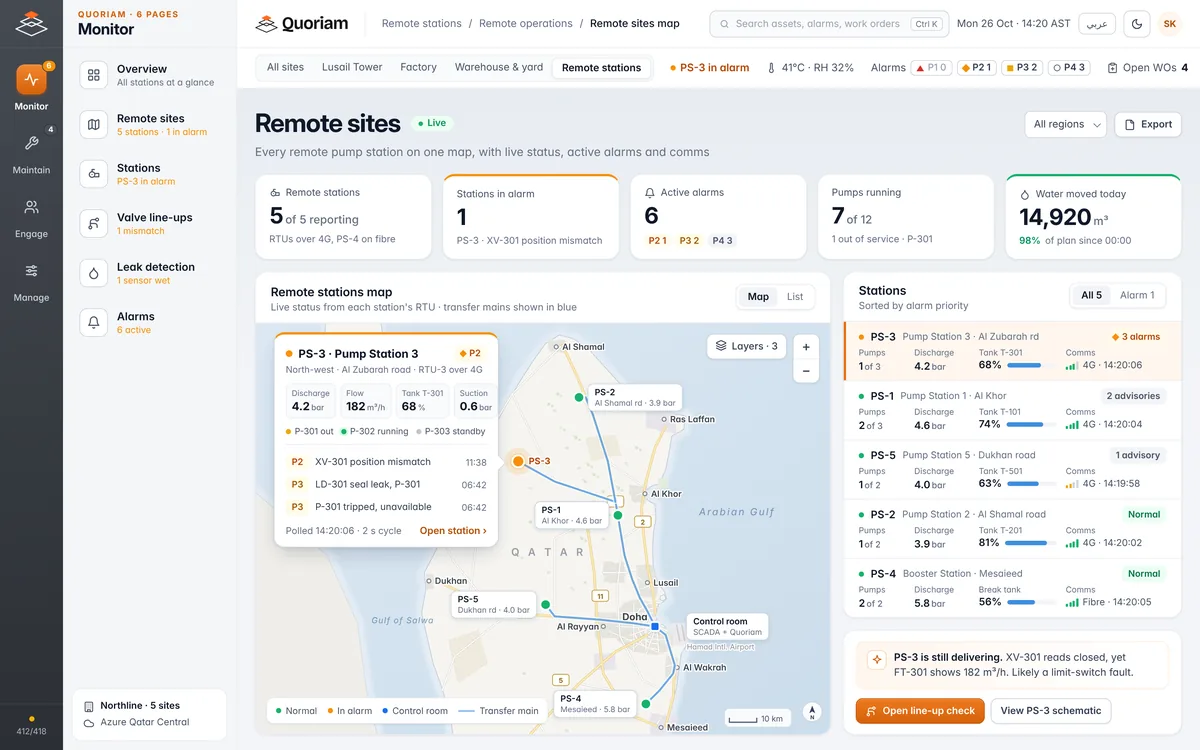
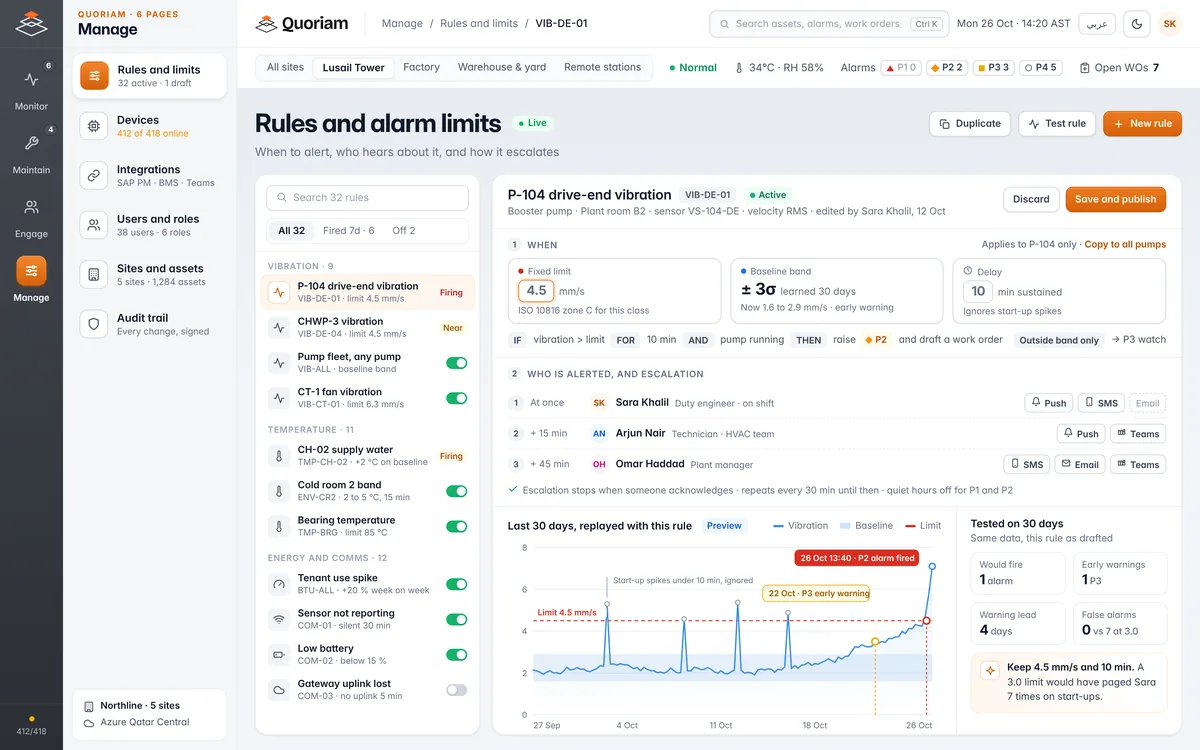
Or just ask.
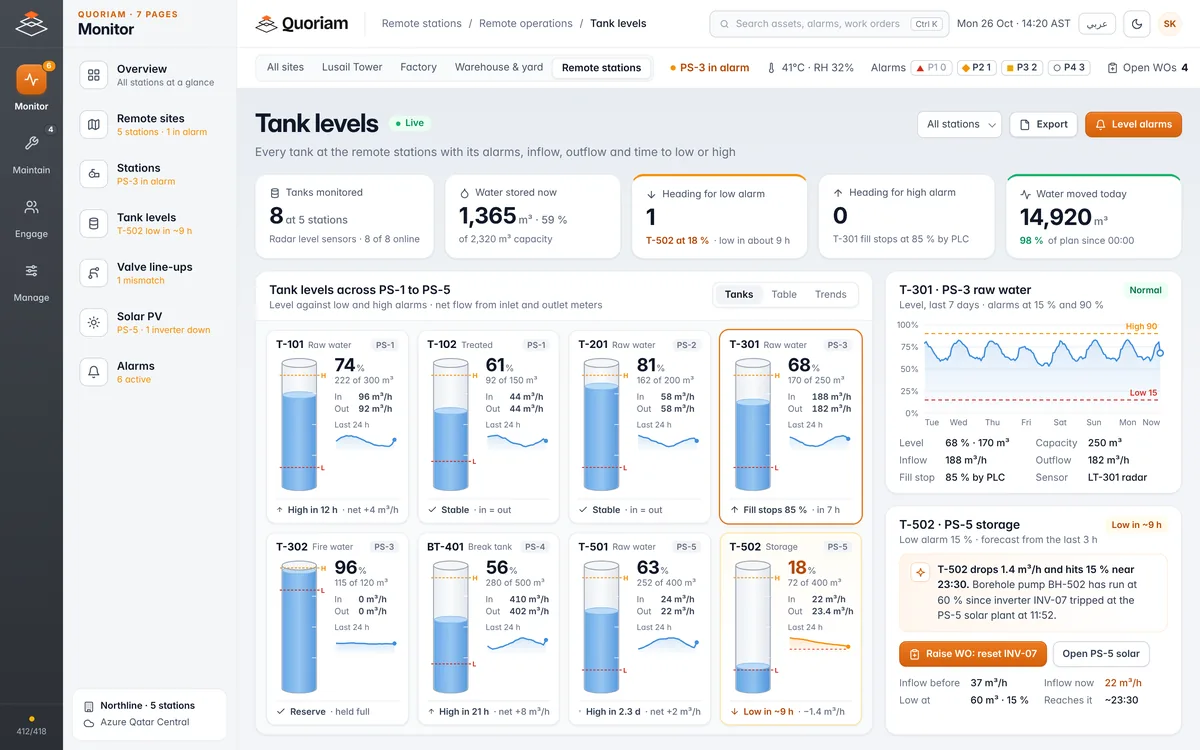
Quoriam AI answers questions about your solar sites in plain language and turns the answer into an action.
Where it's used in Qatar.
Any PV plant that is visited less often than it gets dusty.
Energy and industrial sites
Ground-mounted and carport plants at industrial and energy sites.
Oil, gas and energySolar-powered pump stations
Borehole and booster pumps that slow down when an inverter trips.
Pump station monitoringRooftops on warehouses
Large flat roofs where dust and heat build up unseen.
Logistics and warehousingFarms
Solar irrigation and greenhouse supply far from any team.
Agriculture and food
Questions buyers ask.
Something else? Ask us during the free assessment.
How is solar performance ratio calculated?
Divide the plant's final yield by its reference yield, as IEC 61724-1 defines it. Final yield is the AC energy produced divided by the rated DC power. Reference yield is the irradiation on the modules divided by 1,000 W/m². A plant with no losses beyond its nameplate rating would score 100%; real plants lose some to heat, wiring, inverters and dust.
How often should solar panels be cleaned in Qatar?
As often as the lost energy costs more than the wash. QEERI measured an average soiling loss of 0.41% of daily output per day in Qatar, higher in winter, so the right interval changes through the year. Quoriam prices the soiling loss each day against the cost of a wash and plans cleaning when it pays.
What hardware do we need?
Usually little. Most inverters already report output and string data. We add an irradiance sensor in the plane of the modules, a module temperature sensor and a gateway if the plant has no data logger we can read. The free assessment confirms it plant by plant.
Can it read our inverters and existing monitoring portal?
Quoriam reads solar inverters and the plant meter over Modbus at the plant, so the data sits on the same platform as your pump stations, tanks and other sites, with one alarm list. You can keep the inverter maker's portal for its own diagnostics. Reading from a vendor's cloud portal instead depends on the make.
Can Quoriam reset a tripped inverter?
No. Quoriam raises the alarm with the time of the trip and the energy it is costing, and turns it into a work order for your technician or O&M contractor, who resets or repairs the inverter on site or through its own tools.
What does it cost?
It depends on the number of plants, inverters and strings and what each plant already measures. The free three-week assessment ends with a scope and a fixed price for your sites. You can then prove it on a pilot of a few sites before you commit.
Related.
Solar PV monitoring is part of remote operations monitoring on the Quoriam platform.
- Remote operations monitoring
Valves, tanks, pumps and solar arrays across remote sites on one screen, with alarms on any change.
- Pump station monitoring
Run status, pressure, flow and power at unmanned pump stations.
- Tank level monitoring
Water, diesel and chemical tank levels read remotely, with low-level and leak alarms.
- Smart metering and sub-metering
Meter electricity, water and chilled water by tenant or line, and settle every bill on evidence.
Know what your dust costs.
A free three-week assessment. We review your solar sites and what they already report, then show where monitoring and a cleaning plan will recover the most energy.
We take on two assessments a month.Quoriam is designed to pay back within six months. How we calculate payback