









- Home
- Solutions
- Fleet telematics
- Driver behaviour monitoring
Driver Behaviour Monitoring in Qatar
Speeding, harsh braking, harsh acceleration and idling recorded on every trip, scored per driver each week, with the trip replay to coach from.
Last updated
What is driver behaviour monitoring?
Driver behaviour monitoring uses the tracker in each vehicle to record how it is driven: speed against your policy, harsh braking, acceleration and cornering measured in g-force, and idling with the engine on. Events are weighted into a score per driver, so supervisors coach the few drivers who cause most of the risk and fuel cost.
It is the driving half of fleet telematics. The GPS tracker already knows the speed and the ignition state. An accelerometer inside it measures how hard the vehicle brakes, accelerates and corners. Quoriam turns those readings into events, events into a score, and the score into a coaching list for the supervisor.
What it records.
The events most fleets score, how the tracker detects each one, and why it matters.
| Event | How it is detected | Why it matters |
|---|---|---|
| Speeding | GPS speed above your policy limit, such as a 90 km/h company limit for tippers, for longer than a set time | Longer stopping distances and traffic fines |
| Harsh braking | Deceleration above a set g-force, such as 0.45 g | Can signal close following, a cause of fatal accidents in Qatar |
| Harsh acceleration | Forward g-force above a lower limit, such as 0.35 g | Fuel and tyre wear |
| Harsh cornering | Sideways g-force above the limit for that vehicle type | Rollover risk for loaded tankers and tippers |
| Idling | Ignition on, speed zero, for longer than your idle limit | Fuel cost, worst in summer with the air conditioning running |
| Seatbelt off while moving | Seatbelt signal from the vehicle's CAN bus | Mandatory under Qatar's traffic law |
What Qatar's crash figures say.
Ministry of Interior figures for 2023, and which ones a tracker can see.
| Finding | Figure | What telematics shows |
|---|---|---|
| Road deaths | 168, down from 222 in 2022 | Context: 5.3 deaths per 100,000 people |
| Fatal accidents caused by negligence and recklessness | 49.7% | Speeding and harsh events, per driver and trip |
| Lane deviation | 16.8% | Not visible to a GPS tracker |
| Not leaving a safe following distance | 12.1% | Harsh braking events, which often follow close following |
| Drivers licensed under a year | 42.9% of those at fault in major accidents | New drivers' scores from their first week |
Source: Ministry of Interior figures for 2023, reported by Qatar Tribune, 7 March 2024. Seatbelts are mandatory under Article 54 of Traffic Law No. 19 of 2007, as noted by The Peninsula.
How it works.
Fit
A GPS tracker with a built-in accelerometer goes in each vehicle, wired to ignition and fixed firmly so road vibration doesn't read as harsh driving.
Set the policy
You set speed limits, g-force limits and the idle limit per vehicle type. A loaded tipper and a pick-up get different limits, and each event type gets a weight in the score.
Score
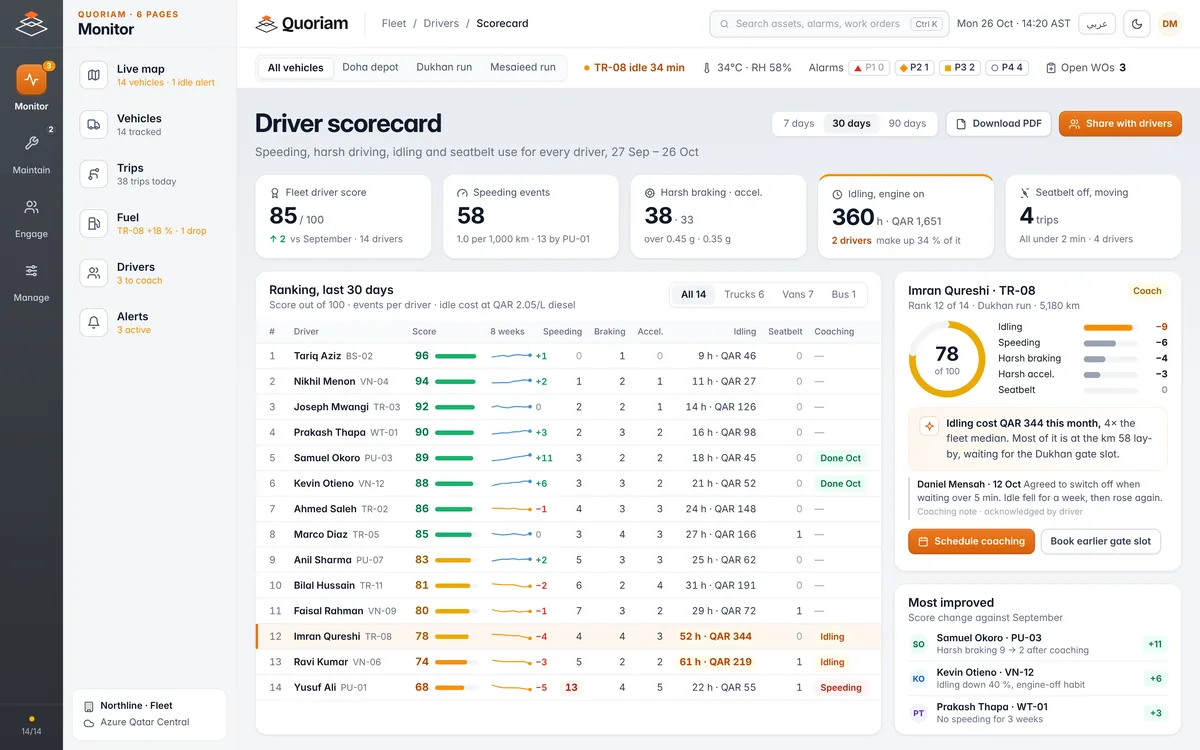
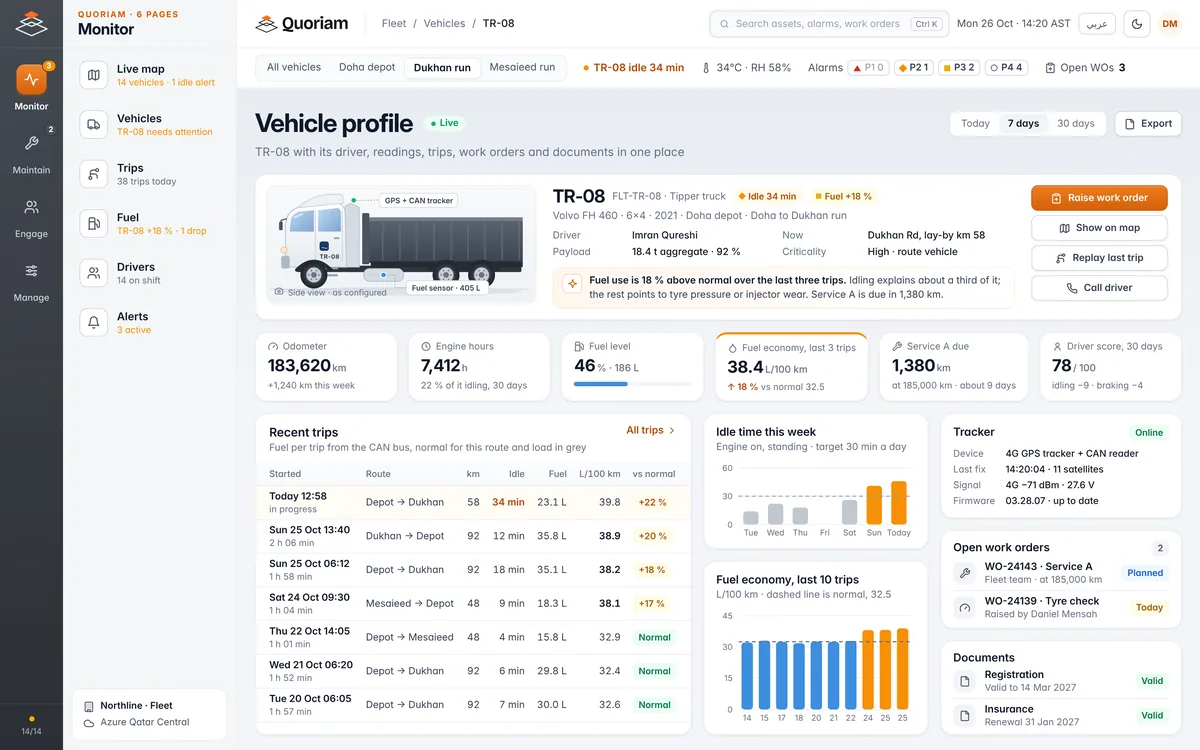
Events are counted per 1,000 km and weighted into a score out of 100. The scorecard ranks drivers over 7, 30 or 90 days and shows which event costs each one most.
Coach
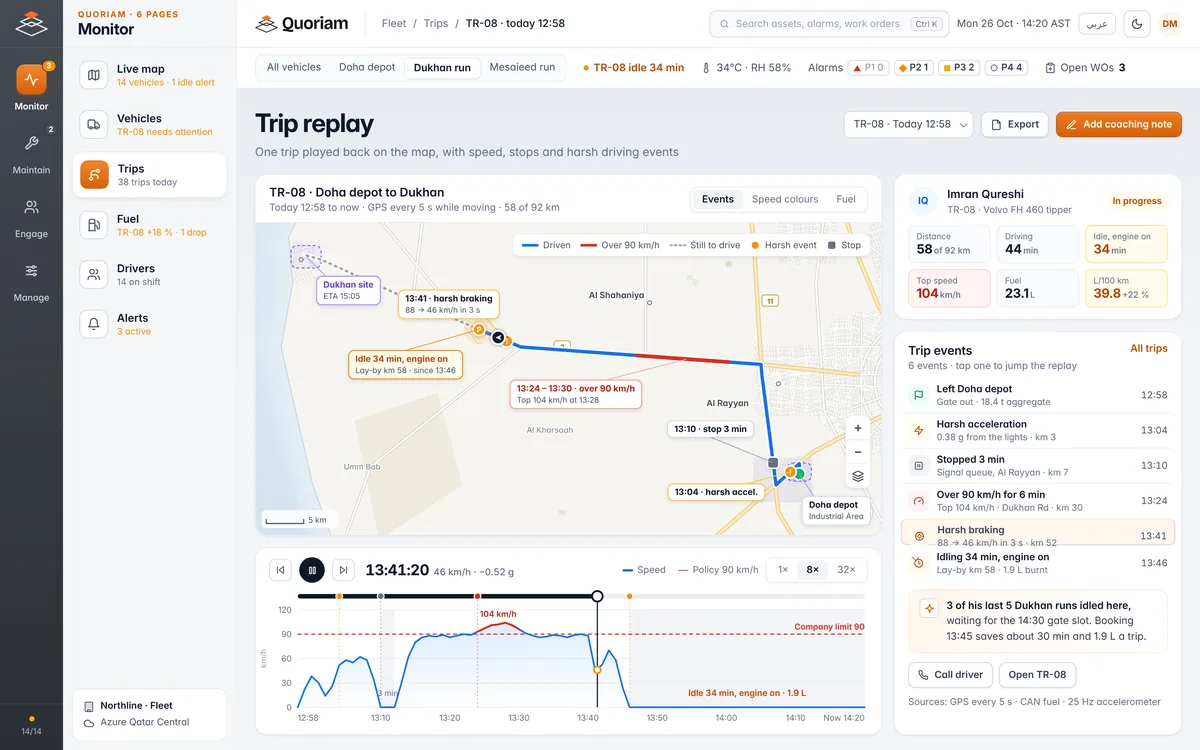
The supervisor opens the trip replay, talks it through with the driver and logs a coaching note. The next weeks' score shows whether the habit changed.
System view
For IT, OT and security reviewers: where the data goes, and how.
- In the vehicleGPS tracker with accelerometer, on ignition and CAN bus
- From the vehicleSpeed, position, g-force events, ignition; seatbelt where the CAN bus shares it
- NetworkCellular from each tracker, encrypted in transit
- Quoriam platformOn your premises or cloud hosted in Qatar
- Your team and systemsScorecards to supervisors and drivers; weekly driver reports by email and Teams
What your team sees.
Who needs coaching, on what, and the trip that shows it.
Or just ask.
Quoriam AI answers questions about your drivers in plain language.
Where it's used in Qatar.
Wherever drivers spend long hours on the road for you.
Construction and aggregates
Loaded tippers and mixers on Dukhan Road and the Mesaieed routes, where harsh cornering and speed carry the most risk.
ConstructionLogistics and distribution
Vans and trucks on tight delivery windows across Doha, where speeding and harsh braking cluster.
Logistics and warehousingOil, gas and energy contractors
Crew buses and service vehicles on the long runs to Ras Laffan and Mesaieed.
Oil, gas and energy
Questions buyers ask.
Something else? Ask us during the free assessment.
What counts as harsh braking?
Deceleration above a set g-force. One tracker maker's default for harsh braking and acceleration is 4.4 m/s², about 0.45 g, and it notes that a large truck needs very different limits from a car. We start from the tracker's defaults, then tune per vehicle type until the events reflect real harsh driving.
How is the driver score calculated?
Each event type is weighted and its points come off 100. The scorecard shows what each event type costs a driver: on the screen above, a score of 78 loses nine points for idling, six for speeding, four for harsh braking and three for harsh acceleration.
How do you know who was driving?
Each vehicle is matched to its driver from your shift or dispatch records, so every trip and event lands on the right person's score. Where drivers swap vehicles often, a driver ID tag or card reader in the cab logs who started each trip. A score is only fair if the trip is on the right name, so we settle this first.
What hardware do we need?
One GPS tracker per vehicle with a built-in accelerometer, wired to ignition and, where the vehicle supports it, reading the CAN bus for seatbelt and engine data. We fit it firmly so the accelerometer reads the vehicle, not a loose bracket. Trackers already in your vehicles may do the job if they can share their data.
Can scores go to HR or our fleet system?
Scorecards download as PDF, and weekly driver reports go to supervisors by email and Teams, as a PDF with an Excel attachment. Sending scores straight into an HR, payroll or fleet management system depends on what that system accepts. We check this in the assessment.
What does it cost, and can we pilot it?
It depends on the number of vehicles and whether trackers are already fitted. The free three-week assessment ends with a scope and a fixed price. A pilot on part of the fleet shows the score moving before you fit every vehicle.
Related.
Driver behaviour monitoring is part of fleet telematics on the Quoriam platform.
Find the habits that cost you most.
A free three-week assessment. We review your vehicles, routes and incident history with your team, then set the limits and scoring that fit your fleet.
We take on two assessments a month.Quoriam is designed to pay back within six months. How we calculate payback